
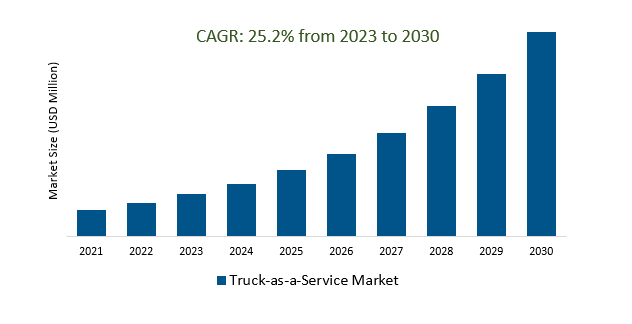
The Global Truck-as-a-Service Market Size is estimated to register 25.2% growth over the forecast period from 2023 to 2030.
The market growth is driven by the increasing integration of digital technologies and IoT in the trucking industry is facilitating better management and tracking of vehicles, contributing to the growth of TaaS. Leading Companies focusing on Expansion of Electric and Sustainable Fleets, Expansion of Electric and Sustainable Fleets, Advanced Telematics and Data Analytics, Digital Platforms and Marketplaces, Market Segmentation, Infrastructure Development, and others to boost market shares in the industry.
The Truck-as-a-Service (TaaS) market provides cost-effective, flexible, and sustainable transportation solutions, offering businesses and individuals access to trucks and related services without the need for private fleet ownership. Key components include fleet management, vehicle leasing, logistics, maintenance, telematics, and data analytics. Market drivers include cost efficiency, sustainability, e-commerce, technology integration, and the globalization of supply chains. However, TaaS providers must navigate regulatory compliance, technological security, and increased competition in a rapidly evolving market.
The surging demand for e-commerce and last-mile delivery is a major catalyst driving the Truck-as-a-Service (TaaS) market, as e-commerce companies turn to TaaS providers for efficient, scalable, and cost-effective solutions. TaaS offers specialized last-mile delivery services, flexibility to adapt to variable demand, reduces capital investment, enhances the customer experience through tracking and transparency, and provides customized vehicle options, enabling e-commerce businesses to swiftly adapt to market trends and expand their geographic reach while optimizing their operations and overall cost efficiency.
The increasing demand for maintenance and telematics services is a pivotal factor propelling the growth of the Truck-as-a-Service (TaaS) market. TaaS providers offer comprehensive maintenance solutions that cover preventive maintenance, repairs, and predictive maintenance based on telematics data. Telematics integration enables real-time monitoring of vehicle performance, fuel consumption, and driver behavior, leading to route optimization, cost savings, and compliance with regulations. This efficient fleet management not only reduces downtime but also enhances safety and overall productivity. TaaS clients benefit from cost savings, data-driven decision-making, and improved safety practices, making maintenance and telematics a driving force behind the TaaS market's expansion.
The growing demand for specialty trucks is a key driver in the expansion of the Truck-as-a-Service (TaaS) market, as businesses seek flexible, cost-effective solutions to meet their unique transportation needs. TaaS providers offer customizable and accessible options, reducing capital expenditures, ensuring regulatory compliance, and providing expertise in maintenance and fleet management for specialized vehicles. This trend is particularly advantageous for industries with evolving requirements, like healthcare, e-commerce, and construction, where TaaS offers an efficient way to access the right type of truck without the burden of ownership.
The Global Truck-as-a-Service Market is analyzed across Digital Freight Brokerage, Telematics, Data Analytics, Truck Platooning, and others. Digital Freight Brokerage is poised to register the fastest growth. The integration of Digital Freight Brokerage with the Truck-as-a-Service (TaaS) market is optimizing logistics by streamlining connections between shippers and TaaS providers through technology, reducing costs, increasing efficiency, and improving transparency. This synergy allows for better access to broader networks, enhances real-time decision-making, offers scalable and flexible solutions, and creates a marketplace for capacity. The collaboration drives competition and innovation, ultimately leading to improved customer experiences and increased value within the logistics and transportation industry.
The Global Truck-as-a-Service Market is analyzed across various Organizations including Chemicals, Pharmaceuticals and Healthcare, Fast-moving Consumer goods, Food and Beverages, and others. Of these, Fast-moving Consumer goods held a significant market share in 2023. The integration of the Fast-moving Consumer Goods (FMCG) industry with the Truck-as-a-Service (TaaS) market is pivotal in meeting the sector's demands for just-in-time deliveries, temperature-controlled transport, seasonal fluctuations, and efficient last-mile delivery. TaaS providers offer scalability, expertise in urban logistics, data-driven efficiency, regulatory compliance, and sustainable transportation options, aligning with the FMCG industry's goals for timely and environmentally responsible product delivery. This collaboration plays a crucial role in enabling FMCG companies to efficiently meet consumer demand, navigate e-commerce integration, and expand into new markets while adhering to stringent regulatory and sustainability standards.
By Type
By End-User
By Region
*List not exhaustive
Truck-as-a-Service Market Outlook 2023
1 Market Overview
1.1 Introduction to the Truck-as-a-Service Market
1.2 Scope of the Study
1.3 Research Objective
1.3.1 Key Market Scope and Segments
1.3.2 Players Covered
1.3.3 Years Considered
2 Executive Summary
2.1 2023 Truck-as-a-Service Industry- Market Statistics
3 Market Dynamics
3.1 Market Drivers
3.2 Market Challenges
3.3 Market Opportunities
3.4 Market Trends
4 Market Factor Analysis
4.1 Porter’s Five Forces
4.2 Market Entropy
4.2.1 Global Truck-as-a-Service Market Companies with Area Served
4.2.2 Products Offerings Global Truck-as-a-Service Market
5 COVID-19 Impact Analysis and Outlook Scenarios
5.1.1 Covid-19 Impact Analysis
5.1.2 Post-COVID-19 Scenario- Low Growth Case
5.1.3 Post-COVID-19 Scenario- Reference Growth Case
5.1.4 Post-COVID-19 Scenario- Low Growth Case
6 Global Truck-as-a-Service Market Trends
6.1 Global Truck-as-a-Service Revenue (USD Million) and CAGR (%) by Type (2018-2030)
6.2 Global Truck-as-a-Service Revenue (USD Million) and CAGR (%) by Applications (2018-2030)
6.3 Global Truck-as-a-Service Revenue (USD Million) and CAGR (%) by Regions (2018-2030)
7 Global Truck-as-a-Service Market Revenue (USD Million) by Type, and Applications (2018-2022)
7.1 Global Truck-as-a-Service Revenue (USD Million) by Type (2018-2022)
7.1.1 Global Truck-as-a-Service Revenue (USD Million), Market Share (%) by Type (2018-2022)
7.2 Global Truck-as-a-Service Revenue (USD Million) by Applications (2018-2022)
7.2.1 Global Truck-as-a-Service Revenue (USD Million), Market Share (%) by Applications (2018-2022)
8 Global Truck-as-a-Service Development Regional Status and Outlook
8.1 Global Truck-as-a-Service Revenue (USD Million) By Regions (2018-2022)
8.2 North America Truck-as-a-Service Revenue (USD Million) by Type, and Application (2018-2022)
8.2.1 North America Truck-as-a-Service Revenue (USD Million) by Country (2018-2022)
8.2.2 North America Truck-as-a-Service Revenue (USD Million) by Type (2018-2022)
8.2.3 North America Truck-as-a-Service Revenue (USD Million) by Applications (2018-2022)
8.3 Europe Truck-as-a-Service Revenue (USD Million), by Type, and Applications (USD Million) (2018-2022)
8.3.1 Europe Truck-as-a-Service Revenue (USD Million), by Country (2018-2022)
8.3.2 Europe Truck-as-a-Service Revenue (USD Million) by Type (2018-2022)
8.3.3 Europe Truck-as-a-Service Revenue (USD Million) by Applications (2018-2022)
8.4 Asia Pacific Truck-as-a-Service Revenue (USD Million), and Revenue (USD Million) by Type, and Applications (2018-2022)
8.4.1 Asia Pacific Truck-as-a-Service Revenue (USD Million) by Country (2018-2022)
8.4.2 Asia Pacific Truck-as-a-Service Revenue (USD Million) by Type (2018-2022)
8.4.3 Asia Pacific Truck-as-a-Service Revenue (USD Million) by Applications (2018-2022)
8.5 South America Truck-as-a-Service Revenue (USD Million), by Type, and Applications (2018-2022)
8.5.1 South America Truck-as-a-Service Revenue (USD Million), by Country (2018-2022)
8.5.2 South America Truck-as-a-Service Revenue (USD Million) by Type (2018-2022)
8.5.3 South America Truck-as-a-Service Revenue (USD Million) by Applications (2018-2022)
8.6 Middle East and Africa Truck-as-a-Service Revenue (USD Million), by Type, Technology, Application, Thickness (2018-2022)
8.6.1 Middle East and Africa Truck-as-a-Service Revenue (USD Million) by Country (2018-2022)
8.6.2 Middle East and Africa Truck-as-a-Service Revenue (USD Million) by Type (2018-2022)
8.6.3 Middle East and Africa Truck-as-a-Service Revenue (USD Million) by Applications (2018-2022)
9 Company Profiles
10 Global Truck-as-a-Service Market Revenue (USD Million), by Type, and Applications (2023-2030)
10.1 Global Truck-as-a-Service Revenue (USD Million) and Market Share (%) by Type (2023-2030)
10.1.1 Global Truck-as-a-Service Revenue (USD Million), and Market Share (%) by Type (2023-2030)
10.2 Global Truck-as-a-Service Revenue (USD Million) and Market Share (%) by Applications (2023-2030)
10.2.1 Global Truck-as-a-Service Revenue (USD Million), and Market Share (%) by Applications (2023-2030)
11 Global Truck-as-a-Service Development Regional Status and Outlook Forecast
11.1 Global Truck-as-a-Service Revenue (USD Million) By Regions (2023-2030)
11.2 North America Truck-as-a-Service Revenue (USD Million) by Type, and Applications (2023-2030)
11.2.1 North America Truck-as-a-Service Revenue (USD) Million by Country (2023-2030)
11.2.2 North America Truck-as-a-Service Revenue (USD Million), by Type (2023-2030)
11.2.3 North America Truck-as-a-Service Revenue (USD Million), Market Share (%) by Applications (2023-2030)
11.3 Europe Truck-as-a-Service Revenue (USD Million), by Type, and Applications (2023-2030)
11.3.1 Europe Truck-as-a-Service Revenue (USD Million), by Country (2023-2030)
11.3.2 Europe Truck-as-a-Service Revenue (USD Million), by Type (2023-2030)
11.3.3 Europe Truck-as-a-Service Revenue (USD Million), by Applications (2023-2030)
11.4 Asia Pacific Truck-as-a-Service Revenue (USD Million) by Type, and Applications (2023-2030)
11.4.1 Asia Pacific Truck-as-a-Service Revenue (USD Million), by Country (2023-2030)
11.4.2 Asia Pacific Truck-as-a-Service Revenue (USD Million), by Type (2023-2030)
11.4.3 Asia Pacific Truck-as-a-Service Revenue (USD Million), by Applications (2023-2030)
11.5 South America Truck-as-a-Service Revenue (USD Million), by Type, and Applications (2023-2030)
11.5.1 South America Truck-as-a-Service Revenue (USD Million), by Country (2023-2030)
11.5.2 South America Truck-as-a-Service Revenue (USD Million), by Type (2023-2030)
11.5.3 South America Truck-as-a-Service Revenue (USD Million), by Applications (2023-2030)
11.6 Middle East and Africa Truck-as-a-Service Revenue (USD Million), by Type, and Applications (2023-2030)
11.6.1 Middle East and Africa Truck-as-a-Service Revenue (USD Million), by Region (2023-2030)
11.6.2 Middle East and Africa Truck-as-a-Service Revenue (USD Million), by Type (2023-2030)
11.6.3 Middle East and Africa Truck-as-a-Service Revenue (USD Million), by Applications (2023-2030)
12 Methodology and Data Sources
12.1 Methodology/Research Approach
12.1.1 Research Programs/Design
12.1.2 Market Size Estimation
12.1.3 Market Breakdown and Data Triangulation
12.2 Data Sources
12.2.1 Secondary Sources
12.2.2 Primary Sources
12.3 Disclaimer
List of Tables
Table 1 Market Segmentation Analysis
Table 2 Global Truck-as-a-Service Market Companies with Areas Served
Table 3 Products Offerings Global Truck-as-a-Service Market
Table 4 Low Growth Scenario Forecasts
Table 5 Reference Case Growth Scenario
Table 6 High Growth Case Scenario
Table 7 Global Truck-as-a-Service Revenue (USD Million) And CAGR (%) By Type (2018-2030)
Table 8 Global Truck-as-a-Service Revenue (USD Million) And CAGR (%) By Applications (2018-2030)
Table 9 Global Truck-as-a-Service Revenue (USD Million) And CAGR (%) By Regions (2018-2030)
Table 10 Global Truck-as-a-Service Revenue (USD Million) By Type (2018-2022)
Table 11 Global Truck-as-a-Service Revenue Market Share (%) By Type (2018-2022)
Table 12 Global Truck-as-a-Service Revenue (USD Million) By Applications (2018-2022)
Table 13 Global Truck-as-a-Service Revenue Market Share (%) By Applications (2018-2022)
Table 14 Global Truck-as-a-Service Market Revenue (USD Million) By Regions (2018-2022)
Table 15 Global Truck-as-a-Service Market Share (%) By Regions (2018-2022)
Table 16 North America Truck-as-a-Service Revenue (USD Million) By Country (2018-2022)
Table 17 North America Truck-as-a-Service Revenue (USD Million) By Type (2018-2022)
Table 18 North America Truck-as-a-Service Revenue (USD Million) By Applications (2018-2022)
Table 19 Europe Truck-as-a-Service Revenue (USD Million) By Country (2018-2022)
Table 20 Europe Truck-as-a-Service Revenue (USD Million) By Type (2018-2022)
Table 21 Europe Truck-as-a-Service Revenue (USD Million) By Applications (2018-2022)
Table 22 Asia Pacific Truck-as-a-Service Revenue (USD Million) By Country (2018-2022)
Table 23 Asia Pacific Truck-as-a-Service Revenue (USD Million) By Type (2018-2022)
Table 24 Asia Pacific Truck-as-a-Service Revenue (USD Million) By Applications (2018-2022)
Table 25 South America Truck-as-a-Service Revenue (USD Million) By Country (2018-2022)
Table 26 South America Truck-as-a-Service Revenue (USD Million) By Type (2018-2022)
Table 27 South America Truck-as-a-Service Revenue (USD Million) By Applications (2018-2022)
Table 28 Middle East and Africa Truck-as-a-Service Revenue (USD Million) By Region (2018-2022)
Table 29 Middle East and Africa Truck-as-a-Service Revenue (USD Million) By Type (2018-2022)
Table 30 Middle East and Africa Truck-as-a-Service Revenue (USD Million) By Applications (2018-2022)
Table 31 Financial Analysis
Table 32 Global Truck-as-a-Service Revenue (USD Million) By Type (2023-2030)
Table 33 Global Truck-as-a-Service Revenue Market Share (%) By Type (2023-2030)
Table 34 Global Truck-as-a-Service Revenue (USD Million) By Applications (2023-2030)
Table 35 Global Truck-as-a-Service Revenue Market Share (%) By Applications (2023-2030)
Table 36 Global Truck-as-a-Service Market Revenue (USD Million), And Revenue (USD Million) By Regions (2023-2030)
Table 37 North America Truck-as-a-Service Revenue (USD)By Country (2023-2030)
Table 38 North America Truck-as-a-Service Revenue (USD Million) By Type (2023-2030)
Table 39 North America Truck-as-a-Service Revenue (USD Million) By Applications (2023-2030)
Table 40 Europe Truck-as-a-Service Revenue (USD Million) By Country (2023-2030)
Table 41 Europe Truck-as-a-Service Revenue (USD Million) By Type (2023-2030)
Table 42 Europe Truck-as-a-Service Revenue (USD Million) By Applications (2023-2030)
Table 43 Asia Pacific Truck-as-a-Service Revenue (USD Million) By Country (2023-2030)
Table 44 Asia Pacific Truck-as-a-Service Revenue (USD Million) By Type (2023-2030)
Table 45 Asia Pacific Truck-as-a-Service Revenue (USD Million) By Applications (2023-2030)
Table 46 South America Truck-as-a-Service Revenue (USD Million) By Country (2023-2030)
Table 47 South America Truck-as-a-Service Revenue (USD Million) By Type (2023-2030)
Table 48 South America Truck-as-a-Service Revenue (USD Million) By Applications (2023-2030)
Table 49 Middle East and Africa Truck-as-a-Service Revenue (USD Million) By Region (2023-2030)
Table 50 Middle East and Africa Truck-as-a-Service Revenue (USD Million) By Region (2023-2030)
Table 51 Middle East and Africa Truck-as-a-Service Revenue (USD Million) By Type (2023-2030)
Table 52 Middle East and Africa Truck-as-a-Service Revenue (USD Million) By Applications (2023-2030)
Table 53 Research Programs/Design for This Report
Table 54 Key Data Information from Secondary Sources
Table 55 Key Data Information from Primary Sources
List of Figures
Figure 1 Market Scope
Figure 2 Porter’s Five Forces
Figure 3 Global Truck-as-a-Service Revenue (USD Million) By Type (2018-2022)
Figure 4 Global Truck-as-a-Service Revenue Market Share (%) By Type (2022)
Figure 5 Global Truck-as-a-Service Revenue (USD Million) By Applications (2018-2022)
Figure 6 Global Truck-as-a-Service Revenue Market Share (%) By Applications (2022)
Figure 7 Global Truck-as-a-Service Market Revenue (USD Million) By Regions (2018-2022)
Figure 8 Global Truck-as-a-Service Market Share (%) By Regions (2022)
Figure 9 North America Truck-as-a-Service Revenue (USD Million) By Country (2018-2022)
Figure 10 North America Truck-as-a-Service Revenue (USD Million) By Type (2018-2022)
Figure 11 North America Truck-as-a-Service Revenue (USD Million) By Applications (2018-2022)
Figure 12 Europe Truck-as-a-Service Revenue (USD Million) By Country (2018-2022)
Figure 13 Europe Truck-as-a-Service Revenue (USD Million) By Type (2018-2022)
Figure 14 Europe Truck-as-a-Service Revenue (USD Million) By Applications (2018-2022)
Figure 15 Asia Pacific Truck-as-a-Service Revenue (USD Million) By Country (2018-2022)
Figure 16 Asia Pacific Truck-as-a-Service Revenue (USD Million) By Type (2018-2022)
Figure 17 Asia Pacific Truck-as-a-Service Revenue (USD Million) By Applications (2018-2022)
Figure 18 South America Truck-as-a-Service Revenue (USD Million) By Country (2018-2022)
Figure 19 South America Truck-as-a-Service Revenue (USD Million) By Type (2018-2022)
Figure 20 South America Truck-as-a-Service Revenue (USD Million) By Applications (2018-2022)
Figure 21 Middle East and Africa Truck-as-a-Service Revenue (USD Million) By Region (2018-2022)
Figure 22 Middle East and Africa Truck-as-a-Service Revenue (USD Million) By Type (2018-2022)
Figure 23 Middle East and Africa Truck-as-a-Service Revenue (USD Million) By Applications (2018-2022)
Figure 24 Global Truck-as-a-Service Revenue (USD Million) By Type (2023-2030)
Figure 25 Global Truck-as-a-Service Revenue Market Share (%) By Type (2030)
Figure 26 Global Truck-as-a-Service Revenue (USD Million) By Applications (2023-2030)
Figure 27 Global Truck-as-a-Service Revenue Market Share (%) By Applications (2030)
Figure 28 Global Truck-as-a-Service Market Revenue (USD Million) By Regions (2023-2030)
Figure 29 North America Truck-as-a-Service Revenue (USD Million) By Country (2023-2030)
Figure 30 North America Truck-as-a-Service Revenue (USD Million) By Type (2023-2030)
Figure 31 North America Truck-as-a-Service Revenue (USD Million) By Applications (2023-2030)
Figure 32 Europe Truck-as-a-Service Revenue (USD Million) By Country (2023-2030)
Figure 33 Europe Truck-as-a-Service Revenue (USD Million) By Type (2023-2030)
Figure 34 Europe Truck-as-a-Service Revenue (USD Million) By Applications (2023-2030)
Figure 35 Asia Pacific Truck-as-a-Service Revenue (USD Million) By Country (2023-2030)
Figure 36 Asia Pacific Truck-as-a-Service Revenue (USD Million) By Type (2023-2030)
Figure 37 Asia Pacific Truck-as-a-Service Revenue (USD Million) By Applications (2023-2030)
Figure 38 South America Truck-as-a-Service Revenue (USD Million) By Country (2023-2030)
Figure 39 South America Truck-as-a-Service Revenue (USD Million) By Type (2023-2030)
Figure 40 South America Truck-as-a-Service Revenue (USD Million) By Applications (2023-2030)
Figure 41 Middle East and Africa Truck-as-a-Service Revenue (USD Million) By Region (2023-2030)
Figure 42 Middle East and Africa Truck-as-a-Service Revenue (USD Million) By Region (2023-2030)
Figure 43 Middle East and Africa Truck-as-a-Service Revenue (USD Million) By Type (2023-2030)
Figure 44 Middle East and Africa Truck-as-a-Service Revenue (USD Million) By Applications (2023-2030)
Figure 45 Bottom-Up and Top-Down Approaches For This Report
Figure 46 Data Triangulation
By Type
By End-User
By Region