
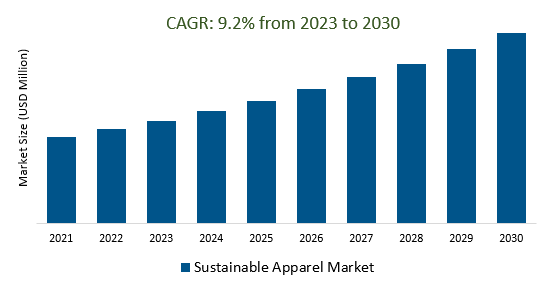
The Global Sustainable Apparel Market Size is estimated to register 9.2% growth over the forecast period from 2023 to 2030.
The market growth is driven by an increasing awareness of environmental and social issues has led to a growing demand for sustainable and ethical clothing. Consumers are willing to pay a premium for products that align with their values. Leading Companies focusing on Market Growth, Innovation in Materials, Transparency and Accountability, Eco-Friendly Supply Chains, Eco-Friendly Packaging, and others to boost market shares in the industry.
The sustainable apparel market focuses on environmentally and socially responsible clothing, emphasizing eco-friendly materials, ethical production, transparency, and waste reduction. It's driven by consumer demand, regulations, and a growing critique of fast fashion. While challenges include higher costs and consumer confusion, the market's future outlook is positive, with continued growth, innovation, and a key role in promoting sustainability in the fashion industry.
Fast fashion, known for its rapid and inexpensive clothing production, is facing increased scrutiny due to its significant environmental and social impacts. Overproduction results in textile waste and environmental harm, while reliance on cheap labor raises labor rights concerns. As a result, consumers are turning to sustainable apparel brands that prioritize eco-friendly materials, ethical production, transparency, and waste reduction, highlighting a shift towards more responsible and eco-conscious fashion practices.
The demand for circular fashion is rapidly increasing as consumers gain awareness of the environmental and social impacts of traditional fashion. Circular fashion promotes a sustainable approach by emphasizing practices such as clothing rental, resale, repair, and upcycling to extend product lifecycles and reduce waste. This shift signifies a significant change in consumer preferences, compelling the fashion industry to adopt more environmentally friendly and socially responsible practices.
Corporate sustainability initiatives are driving growth in the sustainable apparel market, as major fashion brands prioritize eco-friendly materials, ethical labor practices, and transparency in their supply chains. These commitments, often accompanied by ambitious environmental goals, resonate with the increasing number of environmentally conscious consumers and lead to a broader transformation of the fashion industry towards more responsible practices, making corporate sustainability a key driver of market expansion.
The Global Sustainable Apparel Market is analyzed across Organic, Recycled, Regenerated, Natural, and others. Recycled is poised to register the fastest growth. The recycled sustainable apparel market centers on clothing and fashion items made from recycled materials, including post-consumer and pre-consumer waste. It aligns with eco-friendly principles, reducing the demand for new resources, minimizing waste, and promoting sustainability in the fashion industry. As consumers increasingly prioritize environmentally responsible products, this market is growing, offering a wide range of recycled and upcycled fashion items designed to reduce the industry's environmental impact and support a circular economy.
The Global Product Engineering Service Market is analyzed across various Organizations including Cruelty-free Leather, Vegan fur Made, Animal-free wool, Cruelty-free silk, Eco-friendly rubber, and others. Of these, Cruelty-free Leather held a significant market share in 2023. The cruelty-free leather sustainable apparel market offers animal-friendly alternatives to traditional leather, utilizing materials like synthetic or plant-based leather to create ethical and sustainable clothing and accessories. This market caters to consumers seeking fashion items that align with their ethical and environmental values by eliminating animal cruelty and reducing the environmental impact associated with conventional leather production. It represents a growing trend as consumers seek compassionate and eco-conscious alternatives to animal-derived leather products, contributing to a more humane and sustainable fashion industry.
By Type
By Material
By End-User
By Sales Channel
By Region
*List not exhaustive
Sustainable Apparel Market Outlook 2023
1 Market Overview
1.1 Introduction to the Sustainable Apparel Market
1.2 Scope of the Study
1.3 Research Objective
1.3.1 Key Market Scope and Segments
1.3.2 Players Covered
1.3.3 Years Considered
2 Executive Summary
2.1 2023 Sustainable Apparel Industry- Market Statistics
3 Market Dynamics
3.1 Market Drivers
3.2 Market Challenges
3.3 Market Opportunities
3.4 Market Trends
4 Market Factor Analysis
4.1 Porter’s Five Forces
4.2 Market Entropy
4.2.1 Global Sustainable Apparel Market Companies with Area Served
4.2.2 Products Offerings Global Sustainable Apparel Market
5 COVID-19 Impact Analysis and Outlook Scenarios
5.1.1 Covid-19 Impact Analysis
5.1.2 post-COVID-19 Scenario- Low Growth Case
5.1.3 post-COVID-19 Scenario- Reference Growth Case
5.1.4 post-COVID-19 Scenario- Low Growth Case
6 Global Sustainable Apparel Market Trends
6.1 Global Sustainable Apparel Revenue (USD Million) and CAGR (%) by Type (2018-2030)
6.2 Global Sustainable Apparel Revenue (USD Million) and CAGR (%) by Applications (2018-2030)
6.3 Global Sustainable Apparel Revenue (USD Million) and CAGR (%) by regions (2018-2030)
7 Global Sustainable Apparel Market Revenue (USD Million) by Type, and Applications (2018-2022)
7.1 Global Sustainable Apparel Revenue (USD Million) by Type (2018-2022)
7.1.1 Global Sustainable Apparel Revenue (USD Million), Market Share (%) by Type (2018-2022)
7.2 Global Sustainable Apparel Revenue (USD Million) by Applications (2018-2022)
7.2.1 Global Sustainable Apparel Revenue (USD Million), Market Share (%) by Applications (2018-2022)
8 Global Sustainable Apparel Development Regional Status and Outlook
8.1 Global Sustainable Apparel Revenue (USD Million) By Regions (2018-2022)
8.2 North America Sustainable Apparel Revenue (USD Million) by Type, and Application (2018-2022)
8.2.1 North America Sustainable Apparel Revenue (USD Million) by Country (2018-2022)
8.2.2 North America Sustainable Apparel Revenue (USD Million) by Type (2018-2022)
8.2.3 North America Sustainable Apparel Revenue (USD Million) by Applications (2018-2022)
8.3 Europe Sustainable Apparel Revenue (USD Million), by Type, and Applications (USD Million) (2018-2022)
8.3.1 Europe Sustainable Apparel Revenue (USD Million), by Country (2018-2022)
8.3.2 Europe Sustainable Apparel Revenue (USD Million) by Type (2018-2022)
8.3.3 Europe Sustainable Apparel Revenue (USD Million) by Applications (2018-2022)
8.4 Asia Pacific Sustainable Apparel Revenue (USD Million), and Revenue (USD Million) by Type, and Applications (2018-2022)
8.4.1 Asia Pacific Sustainable Apparel Revenue (USD Million) by Country (2018-2022)
8.4.2 Asia Pacific Sustainable Apparel Revenue (USD Million) by Type (2018-2022)
8.4.3 Asia Pacific Sustainable Apparel Revenue (USD Million) by Applications (2018-2022)
8.5 South America Sustainable Apparel Revenue (USD Million), by Type, and Applications (2018-2022)
8.5.1 South America Sustainable Apparel Revenue (USD Million), by Country (2018-2022)
8.5.2 South America Sustainable Apparel Revenue (USD Million) by Type (2018-2022)
8.5.3 South America Sustainable Apparel Revenue (USD Million) by Applications (2018-2022)
8.6 Middle East and Africa Sustainable Apparel Revenue (USD Million), by Type, Technology, Application, Thickness (2018-2022)
8.6.1 Middle East and Africa Sustainable Apparel Revenue (USD Million) by Country (2018-2022)
8.6.2 Middle East and Africa Sustainable Apparel Revenue (USD Million) by Type (2018-2022)
8.6.3 Middle East and Africa Sustainable Apparel Revenue (USD Million) by Applications (2018-2022)
9 Company Profiles
10 Global Sustainable Apparel Market Revenue (USD Million), by Type, and Applications (2023-2030)
10.1 Global Sustainable Apparel Revenue (USD Million) and Market Share (%) by Type (2023-2030)
10.1.1 Global Sustainable Apparel Revenue (USD Million), and Market Share (%) by Type (2023-2030)
10.2 Global Sustainable Apparel Revenue (USD Million) and Market Share (%) by Applications (2023-2030)
10.2.1 Global Sustainable Apparel Revenue (USD Million), and Market Share (%) by Applications (2023-2030)
11 Global Sustainable Apparel Development Regional Status and Outlook Forecast
11.1 Global Sustainable Apparel Revenue (USD Million) By Regions (2023-2030)
11.2 North America Sustainable Apparel Revenue (USD Million) by Type, and Applications (2023-2030)
11.2.1 North America Sustainable Apparel Revenue (USD) Million by Country (2023-2030)
11.2.2 North America Sustainable Apparel Revenue (USD Million), by Type (2023-2030)
11.2.3 North America Sustainable Apparel Revenue (USD Million), Market Share (%) by Applications (2023-2030)
11.3 Europe Sustainable Apparel Revenue (USD Million), by Type, and Applications (2023-2030)
11.3.1 Europe Sustainable Apparel Revenue (USD Million), by Country (2023-2030)
11.3.2 Europe Sustainable Apparel Revenue (USD Million), by Type (2023-2030)
11.3.3 Europe Sustainable Apparel Revenue (USD Million), by Applications (2023-2030)
11.4 Asia Pacific Sustainable Apparel Revenue (USD Million) by Type, and Applications (2023-2030)
11.4.1 Asia Pacific Sustainable Apparel Revenue (USD Million), by Country (2023-2030)
11.4.2 Asia Pacific Sustainable Apparel Revenue (USD Million), by Type (2023-2030)
11.4.3 Asia Pacific Sustainable Apparel Revenue (USD Million), by Applications (2023-2030)
11.5 South America Sustainable Apparel Revenue (USD Million), by Type, and Applications (2023-2030)
11.5.1 South America Sustainable Apparel Revenue (USD Million), by Country (2023-2030)
11.5.2 South America Sustainable Apparel Revenue (USD Million), by Type (2023-2030)
11.5.3 South America Sustainable Apparel Revenue (USD Million), by Applications (2023-2030)
11.6 Middle East and Africa Sustainable Apparel Revenue (USD Million), by Type, and Applications (2023-2030)
11.6.1 Middle East and Africa Sustainable Apparel Revenue (USD Million), by region (2023-2030)
11.6.2 Middle East and Africa Sustainable Apparel Revenue (USD Million), by Type (2023-2030)
11.6.3 Middle East and Africa Sustainable Apparel Revenue (USD Million), by Applications (2023-2030)
12 Methodology and Data Sources
12.1 Methodology/Research Approach
12.1.1 Research Programs/Design
12.1.2 Market Size Estimation
12.1.3 Market Breakdown and Data Triangulation
12.2 Data Sources
12.2.1 Secondary Sources
12.2.2 Primary Sources
12.3 Disclaimer
List of Tables
Table 1 Market Segmentation Analysis
Table 2 Global Sustainable Apparel Market Companies with Areas Served
Table 3 Products Offerings Global Sustainable Apparel Market
Table 4 Low Growth Scenario Forecasts
Table 5 Reference Case Growth Scenario
Table 6 High Growth Case Scenario
Table 7 Global Sustainable Apparel Revenue (USD Million) And CAGR (%) By Type (2018-2030)
Table 8 Global Sustainable Apparel Revenue (USD Million) And CAGR (%) By Applications (2018-2030)
Table 9 Global Sustainable Apparel Revenue (USD Million) And CAGR (%) By Regions (2018-2030)
Table 10 Global Sustainable Apparel Revenue (USD Million) By Type (2018-2022)
Table 11 Global Sustainable Apparel Revenue Market Share (%) By Type (2018-2022)
Table 12 Global Sustainable Apparel Revenue (USD Million) By Applications (2018-2022)
Table 13 Global Sustainable Apparel Revenue Market Share (%) By Applications (2018-2022)
Table 14 Global Sustainable Apparel Market Revenue (USD Million) By Regions (2018-2022)
Table 15 Global Sustainable Apparel Market Share (%) By Regions (2018-2022)
Table 16 North America Sustainable Apparel Revenue (USD Million) By Country (2018-2022)
Table 17 North America Sustainable Apparel Revenue (USD Million) By Type (2018-2022)
Table 18 North America Sustainable Apparel Revenue (USD Million) By Applications (2018-2022)
Table 19 Europe Sustainable Apparel Revenue (USD Million) By Country (2018-2022)
Table 20 Europe Sustainable Apparel Revenue (USD Million) By Type (2018-2022)
Table 21 Europe Sustainable Apparel Revenue (USD Million) By Applications (2018-2022)
Table 22 Asia Pacific Sustainable Apparel Revenue (USD Million) By Country (2018-2022)
Table 23 Asia Pacific Sustainable Apparel Revenue (USD Million) By Type (2018-2022)
Table 24 Asia Pacific Sustainable Apparel Revenue (USD Million) By Applications (2018-2022)
Table 25 South America Sustainable Apparel Revenue (USD Million) By Country (2018-2022)
Table 26 South America Sustainable Apparel Revenue (USD Million) By Type (2018-2022)
Table 27 South America Sustainable Apparel Revenue (USD Million) By Applications (2018-2022)
Table 28 Middle East and Africa Sustainable Apparel Revenue (USD Million) By Region (2018-2022)
Table 29 Middle East and Africa Sustainable Apparel Revenue (USD Million) By Type (2018-2022)
Table 30 Middle East and Africa Sustainable Apparel Revenue (USD Million) By Applications (2018-2022)
Table 31 Financial Analysis
Table 32 Global Sustainable Apparel Revenue (USD Million) By Type (2023-2030)
Table 33 Global Sustainable Apparel Revenue Market Share (%) By Type (2023-2030)
Table 34 Global Sustainable Apparel Revenue (USD Million) By Applications (2023-2030)
Table 35 Global Sustainable Apparel Revenue Market Share (%) By Applications (2023-2030)
Table 36 Global Sustainable Apparel Market Revenue (USD Million), And Revenue (USD Million) By Regions (2023-2030)
Table 37 North America Sustainable Apparel Revenue (USD)By Country (2023-2030)
Table 38 North America Sustainable Apparel Revenue (USD Million) By Type (2023-2030)
Table 39 North America Sustainable Apparel Revenue (USD Million) By Applications (2023-2030)
Table 40 Europe Sustainable Apparel Revenue (USD Million) By Country (2023-2030)
Table 41 Europe Sustainable Apparel Revenue (USD Million) By Type (2023-2030)
Table 42 Europe Sustainable Apparel Revenue (USD Million) By Applications (2023-2030)
Table 43 Asia Pacific Sustainable Apparel Revenue (USD Million) By Country (2023-2030)
Table 44 Asia Pacific Sustainable Apparel Revenue (USD Million) By Type (2023-2030)
Table 45 Asia Pacific Sustainable Apparel Revenue (USD Million) By Applications (2023-2030)
Table 46 South America Sustainable Apparel Revenue (USD Million) By Country (2023-2030)
Table 47 South America Sustainable Apparel Revenue (USD Million) By Type (2023-2030)
Table 48 South America Sustainable Apparel Revenue (USD Million) By Applications (2023-2030)
Table 49 Middle East and Africa Sustainable Apparel Revenue (USD Million) By Region (2023-2030)
Table 50 Middle East and Africa Sustainable Apparel Revenue (USD Million) By Region (2023-2030)
Table 51 Middle East and Africa Sustainable Apparel Revenue (USD Million) By Type (2023-2030)
Table 52 Middle East and Africa Sustainable Apparel Revenue (USD Million) By Applications (2023-2030)
Table 53 Research Programs/Design for This Report
Table 54 Key Data Information from Secondary Sources
Table 55 Key Data Information from Primary Sources
List of Figures
Figure 1 Market Scope
Figure 2 Porter’s Five Forces
Figure 3 Global Sustainable Apparel Revenue (USD Million) By Type (2018-2022)
Figure 4 Global Sustainable Apparel Revenue Market Share (%) By Type (2022)
Figure 5 Global Sustainable Apparel Revenue (USD Million) By Applications (2018-2022)
Figure 6 Global Sustainable Apparel Revenue Market Share (%) By Applications (2022)
Figure 7 Global Sustainable Apparel Market Revenue (USD Million) By Regions (2018-2022)
Figure 8 Global Sustainable Apparel Market Share (%) By Regions (2022)
Figure 9 North America Sustainable Apparel Revenue (USD Million) By Country (2018-2022)
Figure 10 North America Sustainable Apparel Revenue (USD Million) By Type (2018-2022)
Figure 11 North America Sustainable Apparel Revenue (USD Million) By Applications (2018-2022)
Figure 12 Europe Sustainable Apparel Revenue (USD Million) By Country (2018-2022)
Figure 13 Europe Sustainable Apparel Revenue (USD Million) By Type (2018-2022)
Figure 14 Europe Sustainable Apparel Revenue (USD Million) By Applications (2018-2022)
Figure 15 Asia Pacific Sustainable Apparel Revenue (USD Million) By Country (2018-2022)
Figure 16 Asia Pacific Sustainable Apparel Revenue (USD Million) By Type (2018-2022)
Figure 17 Asia Pacific Sustainable Apparel Revenue (USD Million) By Applications (2018-2022)
Figure 18 South America Sustainable Apparel Revenue (USD Million) By Country (2018-2022)
Figure 19 South America Sustainable Apparel Revenue (USD Million) By Type (2018-2022)
Figure 20 South America Sustainable Apparel Revenue (USD Million) By Applications (2018-2022)
Figure 21 Middle East and Africa Sustainable Apparel Revenue (USD Million) By Region (2018-2022)
Figure 22 Middle East and Africa Sustainable Apparel Revenue (USD Million) By Type (2018-2022)
Figure 23 Middle East and Africa Sustainable Apparel Revenue (USD Million) By Applications (2018-2022)
Figure 24 Global Sustainable Apparel Revenue (USD Million) By Type (2023-2030)
Figure 25 Global Sustainable Apparel Revenue Market Share (%) By Type (2030)
Figure 26 Global Sustainable Apparel Revenue (USD Million) By Applications (2023-2030)
Figure 27 Global Sustainable Apparel Revenue Market Share (%) By Applications (2030)
Figure 28 Global Sustainable Apparel Market Revenue (USD Million) By Regions (2023-2030)
Figure 29 North America Sustainable Apparel Revenue (USD Million) By Country (2023-2030)
Figure 30 North America Sustainable Apparel Revenue (USD Million) By Type (2023-2030)
Figure 31 North America Sustainable Apparel Revenue (USD Million) By Applications (2023-2030)
Figure 32 Europe Sustainable Apparel Revenue (USD Million) By Country (2023-2030)
Figure 33 Europe Sustainable Apparel Revenue (USD Million) By Type (2023-2030)
Figure 34 Europe Sustainable Apparel Revenue (USD Million) By Applications (2023-2030)
Figure 35 Asia Pacific Sustainable Apparel Revenue (USD Million) By Country (2023-2030)
Figure 36 Asia Pacific Sustainable Apparel Revenue (USD Million) By Type (2023-2030)
Figure 37 Asia Pacific Sustainable Apparel Revenue (USD Million) By Applications (2023-2030)
Figure 38 South America Sustainable Apparel Revenue (USD Million) By Country (2023-2030)
Figure 39 South America Sustainable Apparel Revenue (USD Million) By Type (2023-2030)
Figure 40 South America Sustainable Apparel Revenue (USD Million) By Applications (2023-2030)
Figure 41 Middle East and Africa Sustainable Apparel Revenue (USD Million) By Region (2023-2030)
Figure 42 Middle East and Africa Sustainable Apparel Revenue (USD Million) By Region (2023-2030)
Figure 43 Middle East and Africa Sustainable Apparel Revenue (USD Million) By Type (2023-2030)
Figure 44 Middle East and Africa Sustainable Apparel Revenue (USD Million) By Applications (2023-2030)
Figure 45 Bottom-Up and Top-Down Approaches for This Report
Figure 46 Data Triangulation
By Type
By Material
By End-User
By Sales Channel
By Region