
Merchant cash advance is increasingly gaining popularity across end-user industries owing to potential benefits including flexibility in fund using, quick and collateral-free access to capital, ease of application process, and flexible repayment terms. Emerging MCAs are increasingly investing in advanced merchant cash advance software to automate merchant cash advance lending servicing by digitizing and streamlining the process.
With rapid growth in small and medium scale enterprises, Merchant cash advances are emerging as popular funding options within the small business financing industry. Accordingly, leading providers offering financing solutions are focusing on streamlined application process, quick approvals, integration with payment systems, customizable funding solutions, real-time analytics, responsive customer support, mobile compatibility, and scalability aspects.
The global MCA market is characterized by a diverse array of providers, ranging from specialized MCA firms to fintech companies and payment processors. These players utilize advanced algorithms and data analytics to assess business performance and tailor financing solutions to meet specific needs. Unlike traditional loans with fixed monthly payments, MCAs are repaid through a percentage of daily credit card sales or other receivables, aligning repayment with business performance. Applications for MCAs are typically processed faster than traditional loans, with funds often available within a few days. This speed and accessibility make them a preferred choice for many businesses.
The digitalization of lending in the MCA space is ushering in greater transparency and flexibility in financing options, enabling tailored funding solutions that align closely with the cash flow patterns and specific requirements of diverse businesses. These platforms are offering an array of benefits, including simplified application processes, expedited approvals, and rapid disbursement of funds, addressing the pressing need for quick access to capital among businesses. Further, the convergence of digital transformation and alternative lending platforms in the MCA market represents a fundamental evolution in how businesses access capital, emphasizing agility, accessibility, and customer-centricity in financial services.
The merchant cash advance (MCA) market is increasingly focusing on offering tailored repayment flexibility to cater to the varied revenue cycles of different businesses. This shift is driven by the understanding that rigid repayment schedules can strain businesses with fluctuating cash flows, especially in industries with seasonal variations or inconsistent sales patterns. Relying on data-driven approach ensures that repayments are manageable and sustainable, helping businesses maintain financial stability while repaying their advances. Different options are being offered to cater to the demand from diverse end-user companies-
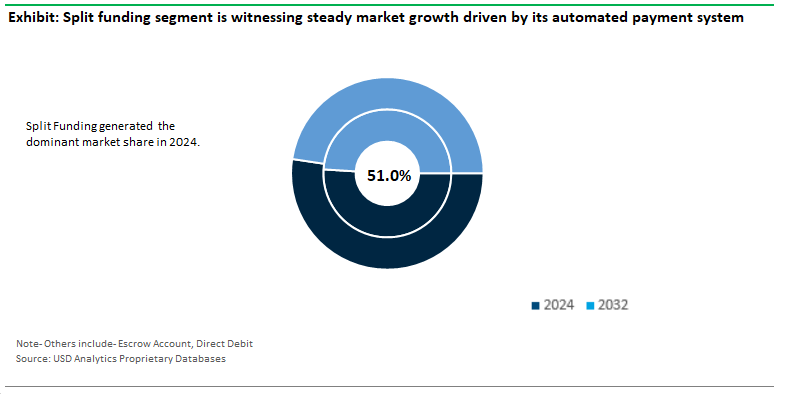
Split funding segment is witnessing steady market growth driven by its automated payment system. Payments are automatically deducted from the merchant's credit card sales, ensuring timely repayments without requiring manual intervention. This helps businesses manage their cash flow effectively, as repayments are based on daily sales, allowing businesses to repay more when sales are high and less during low-revenue periods.
Additionally, split funding simplifies the repayment process for merchants, reducing the administrative burden associated with loan management. The demand for quick capital is a major driver for businesses opting for split funding MCAs, particularly when traditional financing options are unavailable. The flexibility in repayments, which aligns with business revenue cycles, makes split funding an attractive option.
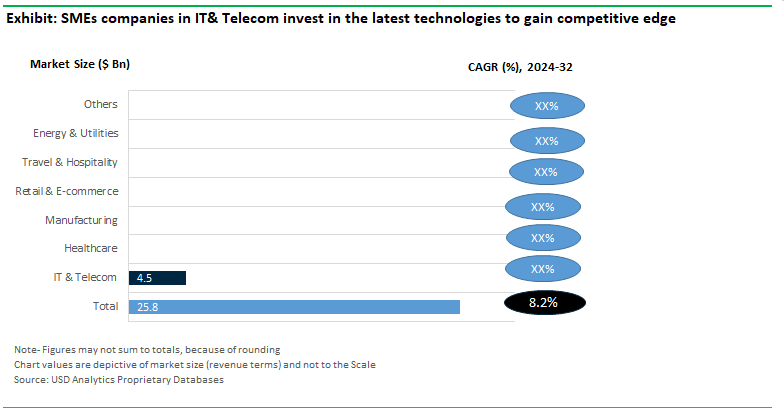
The IT and telecom industry is characterized by rapid technological advancements. Small and medium scale companies within this sector continue to invest in the latest technologies to stay competitive. In particular, IT and telecom businesses often face substantial operational costs, including infrastructure development, software licenses, and employee training.
The demand for IT and telecom services is growing globally, driven by increased digitalization and the expansion of network infrastructure. According to the International Data Corporation (IDC), global spending on IT services by SMEs is projected to grow by 5.1% annually, reaching $684 billion by 2024. The IT and telecom industry is a major employer and driver of economic activity.
In the United States alone, the Bureau of Labor Statistics reported that the tech sector added over 135,000 jobs in 2023, reflecting the sector's continued growth and its need for skilled professionals. Access to quick financing through MCAs enables IT and telecom companies to hire talent, invest in training, and maintain their competitive edge in a rapidly evolving market.
Merchant cash advance is increasingly witnessing market growth in the country with large number of companies providing businesses with upfront cash advances. There are 33.3 million small businesses across the country, employing more than 61.6 million people, as of 2023, according to the SBA (Small Business Administration). Small businesses created 17.3 million net new jobs between 1995 and 2021, accounting for 62.7% of net new jobs created since 1995, according to data from the Bureau of Labor Statistics.
These businesses often require flexible and quick financing solutions to manage cash flow, invest in growth opportunities, and navigate economic uncertainties. The widespread adoption of digital payments in the U.S. also fuels the growth of the MCA market. The Federal Reserve reported that the volume of non-cash payments in the U.S. increased significantly, with credit and debit card transactions making up a substantial portion of these payments.
The industry is fragmented in nature and is characterized by the presence of both capital-intensive global players and medium-scale local companies. Leading companies in the industry include- OnDeck, Lendio, Kabbage, CAN Capital Inc, National Funding, Rapid Finance, Fundbox, National Business Capital, Libertas Funding, Kalamata Capital Group, Perfect Alliance Capital, and others.
|
Stage |
Key Activities |
Key Companies |
Value Addition |
|
Direct Funders |
Provide capital, set terms |
Rapid Finance, CAN Capital, Capify, Credibly |
Capital accessibility, flexible repayment |
|
ISOs and Brokers |
Client acquisition, funder selection |
National Funding Broker Network, Yellowstone Capital, Lendio |
Options for businesses, funder comparison |
|
FinTech Platforms |
Digital applications, streamlined processing |
Fundera, Square Capital, Kabbage |
Accessibility, faster approvals |
|
Data Analytics & Credit Scoring |
Risk assessment, data analysis |
Experian, FICO, OnDeck |
Improved credit decisions, reduced default rates |
|
Payment Processors |
Repayment management, POS integration |
Stripe, PayPal, First Data |
Automated collections, reduced admin burden |
|
Legal & Compliance Services |
Regulatory compliance, legal support |
Hudson Cook LLP, Greenberg Traurig LLP, Buckley LLP |
Regulatory risk management, legal protection |
|
Customer Support & Risk Management |
Default management, customer service |
Triton Recovery Group, Revcom Group, Credibly |
Risk mitigation, enhanced client experience |
|
Parameter |
Details |
|
Market Size (2024) |
$25.8 Billion |
|
Market Size (2032) |
$48.6 Billion |
|
Market Growth Rate |
8.2% |
|
Largest Segment- Types |
Split Funding (51% Market Share) |
|
Largest Growing Segment- Applications |
IT & Telecom ($4.5 Billion Revenue) |
|
Potential Market |
United States ($5.2 Billion Sales) |
|
Segments |
Types, Sales Channels, Applications |
|
Study Period |
2018- 2023 and 2024-2032 |
|
Units |
Revenue (USD) |
|
Qualitative Analysis |
Porter’s Five Forces, SWOT Profile, Market Share, Scenario Forecasts, Market Ecosystem, Company Ranking, Market Dynamics, Industry Benchmarking |
|
Companies |
Lendio , Fundbox , CAN Capital Inc, National Business Capital , Kabbage , Rapid Finance , National Funding , Kalamata Capital Group , Libertas Funding , Perfect Alliance Capital , OnDeck |
|
Countries |
US, Canada, Mexico, Germany, France, Spain, Italy, UK, Russia, China, India, Japan, South Korea, Australia, South East Asia, Brazil, Argentina, Middle East, Africa |
Type
Applications
Countries Analyzed
Merchant Cash Advance Companies Profiled in the Study
*- List Not Exhaustive
About USD Analytics
Table of Contents
1. Executive Summary
What’s New in 2024?
Top 10 Takeaways from the Industry
Potential Opportunities for Industry Stakeholders
Strategic Imperatives
Company Market Positioning
Industry Benchmarking Matrix
2. Research Scope and Methodology
Market Definition
Market Segments
Companies Profiled
Research Methodology
Data Sources
Conversion Rates for USD
Abbreviations
3. Strategic Landscape: Key Insights and Implications
Spotlight: Key Strategies Opted by Business Leaders
Competitive Landscape
SWOT Analysis
Porter’s Five Force Analysis
Macro-Environmental Analysis
4. Growth Opportunity Analysis
Trends at a Glance
Market Dynamics
Key Industry Stakeholders
Regulatory Landscape
5. Market Size Outlook to 2032
Global Merchant Cash Advance Market Size Forecast, USD Million, 2018- 2032
Scenario Analysis
Pricing Analysis and Outlook
6. Historical Merchant Cash Advance Market Size by Segments, 2018- 2023
Key Statistics, 2024
Merchant Cash Advance Market Size Outlook by Type, USD Million, 2018-2023
Growth Comparison (y-o-y) across Merchant Cash Advance Types, 2018-2023
Merchant Cash Advance Market Size Outlook by Application, USD Million, 2018-2023
Growth Comparison (y-o-y) across Merchant Cash Advance Applications, 2018-2023
7. Merchant Cash Advance Market Size Outlook by Segments, 2024- 2032
Merchant Cash Advance Market Size Outlook by Type, USD Million, 2024-2032
Growth Comparison (y-o-y) across Merchant Cash Advance Types, 2024-2032
Merchant Cash Advance Market Size Outlook by Application, USD Million, 2024-2032
Growth Comparison (y-o-y) across Merchant Cash Advance Applications, 2024-2032
8. Merchant Cash Advance Market Size Outlook by Region
North America
Europe
Asia Pacific
South America
Middle East and Africa
9. United States Merchant Cash Advance Market Analysis and Outlook, 2021- 2032
Key Statistics
United States Merchant Cash Advance Market Size Outlook by Type, 2021- 2032
United States Merchant Cash Advance Market Size Outlook by Application, 2021- 2032
United States Merchant Cash Advance Market Size Outlook by End-User, 2021- 2032
10. Canada Merchant Cash Advance Market Analysis and Outlook, 2021- 2032
Key Statistics
Canada Merchant Cash Advance Market Size Outlook by Type, 2021- 2032
Canada Merchant Cash Advance Market Size Outlook by Application, 2021- 2032
Canada Merchant Cash Advance Market Size Outlook by End-User, 2021- 2032
11. Mexico Merchant Cash Advance Market Analysis and Outlook, 2021- 2032
Key Statistics
Mexico Merchant Cash Advance Market Size Outlook by Type, 2021- 2032
Mexico Merchant Cash Advance Market Size Outlook by Application, 2021- 2032
Mexico Merchant Cash Advance Market Size Outlook by End-User, 2021- 2032
12. Germany Merchant Cash Advance Market Analysis and Outlook, 2021- 2032
Key Statistics
Germany Merchant Cash Advance Market Size Outlook by Type, 2021- 2032
Germany Merchant Cash Advance Market Size Outlook by Application, 2021- 2032
Germany Merchant Cash Advance Market Size Outlook by End-User, 2021- 2032
13. France Merchant Cash Advance Market Analysis and Outlook, 2021- 2032
Key Statistics
France Merchant Cash Advance Market Size Outlook by Type, 2021- 2032
France Merchant Cash Advance Market Size Outlook by Application, 2021- 2032
France Merchant Cash Advance Market Size Outlook by End-User, 2021- 2032
14. United Kingdom Merchant Cash Advance Market Analysis and Outlook, 2021- 2032
Key Statistics
United Kingdom Merchant Cash Advance Market Size Outlook by Type, 2021- 2032
United Kingdom Merchant Cash Advance Market Size Outlook by Application, 2021- 2032
United Kingdom Merchant Cash Advance Market Size Outlook by End-User, 2021- 2032
15. Spain Merchant Cash Advance Market Analysis and Outlook, 2021- 2032
Key Statistics
Spain Merchant Cash Advance Market Size Outlook by Type, 2021- 2032
Spain Merchant Cash Advance Market Size Outlook by Application, 2021- 2032
Spain Merchant Cash Advance Market Size Outlook by End-User, 2021- 2032
16. Italy Merchant Cash Advance Market Analysis and Outlook, 2021- 2032
Key Statistics
Italy Merchant Cash Advance Market Size Outlook by Type, 2021- 2032
Italy Merchant Cash Advance Market Size Outlook by Application, 2021- 2032
Italy Merchant Cash Advance Market Size Outlook by End-User, 2021- 2032
17. Benelux Merchant Cash Advance Market Analysis and Outlook, 2021- 2032
Key Statistics
Benelux Merchant Cash Advance Market Size Outlook by Type, 2021- 2032
Benelux Merchant Cash Advance Market Size Outlook by Application, 2021- 2032
Benelux Merchant Cash Advance Market Size Outlook by End-User, 2021- 2032
18. Nordic Merchant Cash Advance Market Analysis and Outlook, 2021- 2032
Key Statistics
Nordic Merchant Cash Advance Market Size Outlook by Type, 2021- 2032
Nordic Merchant Cash Advance Market Size Outlook by Application, 2021- 2032
Nordic Merchant Cash Advance Market Size Outlook by End-User, 2021- 2032
19. Rest of Europe Merchant Cash Advance Market Analysis and Outlook, 2021- 2032
Key Statistics
Rest of Europe Merchant Cash Advance Market Size Outlook by Type, 2021- 2032
Rest of Europe Merchant Cash Advance Market Size Outlook by Application, 2021- 2032
Rest of Europe Merchant Cash Advance Market Size Outlook by End-User, 2021- 2032
20. China Merchant Cash Advance Market Analysis and Outlook, 2021- 2032
Key Statistics
China Merchant Cash Advance Market Size Outlook by Type, 2021- 2032
China Merchant Cash Advance Market Size Outlook by Application, 2021- 2032
China Merchant Cash Advance Market Size Outlook by End-User, 2021- 2032
21. India Merchant Cash Advance Market Analysis and Outlook, 2021- 2032
Key Statistics
India Merchant Cash Advance Market Size Outlook by Type, 2021- 2032
India Merchant Cash Advance Market Size Outlook by Application, 2021- 2032
India Merchant Cash Advance Market Size Outlook by End-User, 2021- 2032
22. Japan Merchant Cash Advance Market Analysis and Outlook, 2021- 2032
Key Statistics
Japan Merchant Cash Advance Market Size Outlook by Type, 2021- 2032
Japan Merchant Cash Advance Market Size Outlook by Application, 2021- 2032
Japan Merchant Cash Advance Market Size Outlook by End-User, 2021- 2032
23. South Korea Merchant Cash Advance Market Analysis and Outlook, 2021- 2032
Key Statistics
South Korea Merchant Cash Advance Market Size Outlook by Type, 2021- 2032
South Korea Merchant Cash Advance Market Size Outlook by Application, 2021- 2032
South Korea Merchant Cash Advance Market Size Outlook by End-User, 2021- 2032
24. Australia Merchant Cash Advance Market Analysis and Outlook, 2021- 2032
Key Statistics
Australia Merchant Cash Advance Market Size Outlook by Type, 2021- 2032
Australia Merchant Cash Advance Market Size Outlook by Application, 2021- 2032
Australia Merchant Cash Advance Market Size Outlook by End-User, 2021- 2032
25. South East Asia Merchant Cash Advance Market Analysis and Outlook, 2021- 2032
Key Statistics
South East Asia Merchant Cash Advance Market Size Outlook by Type, 2021- 2032
South East Asia Merchant Cash Advance Market Size Outlook by Application, 2021- 2032
South East Asia Merchant Cash Advance Market Size Outlook by End-User, 2021- 2032
26. Rest of Asia Pacific Merchant Cash Advance Market Analysis and Outlook, 2021- 2032
Key Statistics
Rest of Asia Pacific Merchant Cash Advance Market Size Outlook by Type, 2021- 2032
Rest of Asia Pacific Merchant Cash Advance Market Size Outlook by Application, 2021- 2032
Rest of Asia Pacific Merchant Cash Advance Market Size Outlook by End-User, 2021- 2032
27. Brazil Merchant Cash Advance Market Analysis and Outlook, 2021- 2032
Key Statistics
Brazil Merchant Cash Advance Market Size Outlook by Type, 2021- 2032
Brazil Merchant Cash Advance Market Size Outlook by Application, 2021- 2032
Brazil Merchant Cash Advance Market Size Outlook by End-User, 2021- 2032
28. Argentina Merchant Cash Advance Market Analysis and Outlook, 2021- 2032
Key Statistics
Argentina Merchant Cash Advance Market Size Outlook by Type, 2021- 2032
Argentina Merchant Cash Advance Market Size Outlook by Application, 2021- 2032
Argentina Merchant Cash Advance Market Size Outlook by End-User, 2021- 2032
29. Rest of South America Merchant Cash Advance Market Analysis and Outlook, 2021- 2032
Key Statistics
Rest of South America Merchant Cash Advance Market Size Outlook by Type, 2021- 2032
Rest of South America Merchant Cash Advance Market Size Outlook by Application, 2021- 2032
Rest of South America Merchant Cash Advance Market Size Outlook by End-User, 2021- 2032
30. United Arab Emirates Merchant Cash Advance Market Analysis and Outlook, 2021- 2032
Key Statistics
United Arab Emirates Merchant Cash Advance Market Size Outlook by Type, 2021- 2032
United Arab Emirates Merchant Cash Advance Market Size Outlook by Application, 2021- 2032
United Arab Emirates Merchant Cash Advance Market Size Outlook by End-User, 2021- 2032
31. Saudi Arabia Merchant Cash Advance Market Analysis and Outlook, 2021- 2032
Key Statistics
Saudi Arabia Merchant Cash Advance Market Size Outlook by Type, 2021- 2032
Saudi Arabia Merchant Cash Advance Market Size Outlook by Application, 2021- 2032
Saudi Arabia Merchant Cash Advance Market Size Outlook by End-User, 2021- 2032
32. Rest of Middle East Merchant Cash Advance Market Analysis and Outlook, 2021- 2032
Key Statistics
Rest of Middle East Merchant Cash Advance Market Size Outlook by Type, 2021- 2032
Rest of Middle East Merchant Cash Advance Market Size Outlook by Application, 2021- 2032
Rest of Middle East Merchant Cash Advance Market Size Outlook by End-User, 2021- 2032
33. South Africa Merchant Cash Advance Market Analysis and Outlook, 2021- 2032
Key Statistics
South Africa Merchant Cash Advance Market Size Outlook by Type, 2021- 2032
South Africa Merchant Cash Advance Market Size Outlook by Application, 2021- 2032
South Africa Merchant Cash Advance Market Size Outlook by End-User, 2021- 2032
34. Rest of Africa Merchant Cash Advance Market Analysis and Outlook, 2021- 2032
Key Statistics
Rest of Africa Merchant Cash Advance Market Size Outlook by Type, 2021- 2032
Rest of Africa Merchant Cash Advance Market Size Outlook by Application, 2021- 2032
Rest of Africa Merchant Cash Advance Market Size Outlook by End-User, 2021- 2032
35. Key Companies
Market Share Analysis
Company Benchmarking
SWOT Analysis
36. Recent Market Developments
Appendix
Looking Ahead
Research Methodology
Legal Disclaimer
Type
Applications
Countries Analyzed
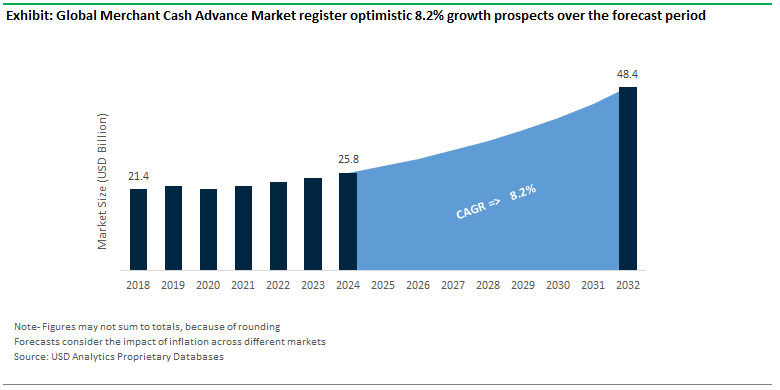
USD Analytics forecasts the global Merchant Cash Advance market size to increase from $25.8 Billion in 2024 to $48.6 Billion in 2032, registering a CAGR of 8.2% during the forecast period
Largest Segment by Type is Split Funding (51% Market Share), Largest Growing Segment by Application is IT & Telecom ($4.5 Billion Revenue)
Lendio , Fundbox , CAN Capital Inc, National Business Capital , Kabbage , Rapid Finance , National Funding , Kalamata Capital Group , Libertas Funding , Perfect Alliance Capital , OnDeck
Base Year- 2023; Estimated Year- 2024; Historic Period- 2018-2023; Forecast period- 2024 to 2032; Currency: USD; Volume
United States ($5.2 Billion Sales)