
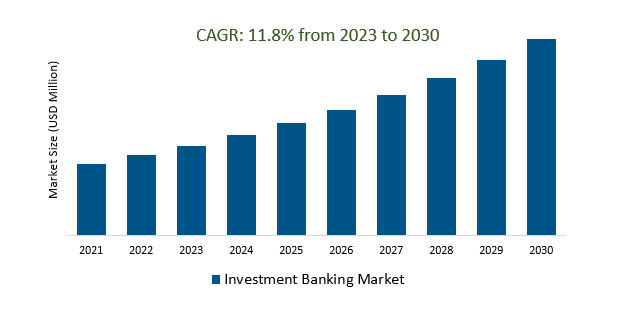
The Global Investment Banking Market Size is estimated to register 11.8% growth over the forecast period from 2023 to 2030.
The market growth is driven by an increasing focus on Environmental, Social, and Governance (ESG) criteria pushing investment banks to offer ESG-related financial products and services to meet the demand for sustainable investments. Leading Companies focusing on, and others to boost market shares in the industry.
Investment banking is a vital sector of the financial industry that offers advisory, underwriting, and financial services to clients, including M&A guidance, underwriting of securities, and capital raising. Major players in the field include global giants like Goldman Sachs and JPMorgan Chase. The industry is strongly influenced by regulatory changes, economic conditions, and technological advancements. Some key drivers as of 2021 were the shift towards digitalization, increased focus on sustainable finance, and competition from fintech companies. Investment banks must also navigate challenges related to market volatility, regulatory compliance, and cybersecurity while adapting to evolving client preferences. The industry's global presence and emphasis on sustainable finance are notable trends, with investment banks investing in technology to enhance their offerings and services.
A client-centric approach in the investment banking market prioritizes personalized financial solutions tailored to each client's unique needs and objectives. Investment banks leverage advanced technologies and data analytics to gain insights into clients' financial positions and risk profiles, enabling them to provide informed, strategic advice. This approach fosters trust, and long-term relationships, and aligns with broader industry trends, such as sustainable finance. In a dynamic and competitive market, the adoption of a client-centric strategy empowers investment banks to meet evolving client demands and gain a competitive edge.
Investment banks are meeting the surging demand from institutional investors by expanding their services to encompass cryptocurrency and blockchain offerings. These services, including digital asset custody, cryptocurrency trading, and blockchain advisory, acknowledge the significance of digital assets in the financial sector. By entering these markets, investment banks aim to provide secure and regulated avenues for institutional investors to participate in the cryptocurrency space, capitalizing on its potential for returns and diversification. This strategic shift also aligns with the broader adoption of blockchain technology in finance.
Investment banking firms are increasingly expanding into emerging markets due to the strong economic growth and heightened capital requirements in these regions. This expansion enables them to provide a range of financial services to local businesses and governments, fostering relationships and capitalizing on growth opportunities. By doing so, they enhance their global market presence while addressing the specific challenges of emerging markets and strengthening their client's access to diverse investment opportunities.
The Global Investment Banking Market is analyzed across Mergers and Acquisitions, Equity Capital Markets, Debt Capital Markets, Financial Sponsor/Syndicated Loans, and others. Financial Sponsor/Syndicated Loans is poised to register the fastest growth. Financial sponsors, including private equity firms, play a pivotal role in investment banking by engaging in mergers and acquisitions. Investment banks provide crucial advisory, financing, and strategic guidance to these sponsors during such transactions. Syndicated loans, another integral part of investment banking, involve investment banks acting as intermediaries between borrowers and groups of lenders. They facilitate the structuring and distribution of large loans to corporate clients for purposes like acquisitions or refinancing. This interaction underscores the collaborative nature of investment banking, where investment banks connect financial sponsors with lending opportunities through syndicated loans, contributing to the efficient flow of capital within the financial landscape.
The Global Investment Banking Market is analyzed across various Enterprise Sizes including SMEs, Large Enterprises, and others. Of these, SMEs held a significant market share in 2023. Small and Medium-sized Enterprises (SMEs) are a significant and diverse segment within the Investment Banking market. Investment banks offer a range of services to support SMEs, including capital raising, mergers and acquisitions advice, strategic guidance, private equity and venture capital connections, risk management, and market research. This collaboration underscores the vital role investment banks play in facilitating the growth and financial needs of SMEs, ultimately contributing to their success and the overall dynamism of the Investment Banking market.
By Type
By Enterprise Size
By End-User
By Region
*List not exhaustive
Investment Banking Market Outlook 2023
1 Market Overview
1.1 Introduction to the Investment Banking Market
1.2 Scope of the Study
1.3 Research Objective
1.3.1 Key Market Scope and Segments
1.3.2 Players Covered
1.3.3 Years Considered
2 Executive Summary
2.1 2023 Investment Banking Industry- Market Statistics
3 Market Dynamics
3.1 Market Drivers
3.2 Market Challenges
3.3 Market Opportunities
3.4 Market Trends
4 Market Factor Analysis
4.1 Porter’s Five Forces
4.2 Market Entropy
4.2.1 Global Investment Banking Market Companies with Area Served
4.2.2 Products Offerings Global Investment Banking Market
5 COVID-19 Impact Analysis and Outlook Scenarios
5.1.1 Covid-19 Impact Analysis
5.1.2 Post-COVID-19 Scenario- Low Growth Case
5.1.3 Post-COVID-19 Scenario- Reference Growth Case
5.1.4 Post-COVID-19 Scenario- Low Growth Case
6 Global Investment Banking Market Trends
6.1 Global Investment Banking Revenue (USD Million) and CAGR (%) by Type (2018-2030)
6.2 Global Investment Banking Revenue (USD Million) and CAGR (%) by Applications (2018-2030)
6.3 Global Investment Banking Revenue (USD Million) and CAGR (%) by Regions (2018-2030)
7 Global Investment Banking Market Revenue (USD Million) by Type, and Applications (2018-2022)
7.1 Global Investment Banking Revenue (USD Million) by Type (2018-2022)
7.1.1 Global Investment Banking Revenue (USD Million), Market Share (%) by Type (2018-2022)
7.2 Global Investment Banking Revenue (USD Million) by Applications (2018-2022)
7.2.1 Global Investment Banking Revenue (USD Million), Market Share (%) by Applications (2018-2022)
8 Global Investment Banking Development Regional Status and Outlook
8.1 Global Investment Banking Revenue (USD Million) By Regions (2018-2022)
8.2 North America Investment Banking Revenue (USD Million) by Type, and Application (2018-2022)
8.2.1 North America Investment Banking Revenue (USD Million) by Country (2018-2022)
8.2.2 North America Investment Banking Revenue (USD Million) by Type (2018-2022)
8.2.3 North America Investment Banking Revenue (USD Million) by Applications (2018-2022)
8.3 Europe Investment Banking Revenue (USD Million), by Type, and Applications (USD Million) (2018-2022)
8.3.1 Europe Investment Banking Revenue (USD Million), by Country (2018-2022)
8.3.2 Europe Investment Banking Revenue (USD Million) by Type (2018-2022)
8.3.3 Europe Investment Banking Revenue (USD Million) by Applications (2018-2022)
8.4 Asia Pacific Investment Banking Revenue (USD Million), and Revenue (USD Million) by Type, and Applications (2018-2022)
8.4.1 Asia Pacific Investment Banking Revenue (USD Million) by Country (2018-2022)
8.4.2 Asia Pacific Investment Banking Revenue (USD Million) by Type (2018-2022)
8.4.3 Asia Pacific Investment Banking Revenue (USD Million) by Applications (2018-2022)
8.5 South America Investment Banking Revenue (USD Million), by Type, and Applications (2018-2022)
8.5.1 South America Investment Banking Revenue (USD Million), by Country (2018-2022)
8.5.2 South America Investment Banking Revenue (USD Million) by Type (2018-2022)
8.5.3 South America Investment Banking Revenue (USD Million) by Applications (2018-2022)
8.6 Middle East and Africa Investment Banking Revenue (USD Million), by Type, Technology, Application, Thickness (2018-2022)
8.6.1 Middle East and Africa Investment Banking Revenue (USD Million) by Country (2018-2022)
8.6.2 Middle East and Africa Investment Banking Revenue (USD Million) by Type (2018-2022)
8.6.3 Middle East and Africa Investment Banking Revenue (USD Million) by Applications (2018-2022)
9 Company Profiles
10 Global Investment Banking Market Revenue (USD Million), by Type, and Applications (2023-2030)
10.1 Global Investment Banking Revenue (USD Million) and Market Share (%) by Type (2023-2030)
10.1.1 Global Investment Banking Revenue (USD Million), and Market Share (%) by Type (2023-2030)
10.2 Global Investment Banking Revenue (USD Million) and Market Share (%) by Applications (2023-2030)
10.2.1 Global Investment Banking Revenue (USD Million), and Market Share (%) by Applications (2023-2030)
11 Global Investment Banking Development Regional Status and Outlook Forecast
11.1 Global Investment Banking Revenue (USD Million) By Regions (2023-2030)
11.2 North America Investment Banking Revenue (USD Million) by Type, and Applications (2023-2030)
11.2.1 North America Investment Banking Revenue (USD) Million by Country (2023-2030)
11.2.2 North America Investment Banking Revenue (USD Million), by Type (2023-2030)
11.2.3 North America Investment Banking Revenue (USD Million), Market Share (%) by Applications (2023-2030)
11.3 Europe Investment Banking Revenue (USD Million), by Type, and Applications (2023-2030)
11.3.1 Europe Investment Banking Revenue (USD Million), by Country (2023-2030)
11.3.2 Europe Investment Banking Revenue (USD Million), by Type (2023-2030)
11.3.3 Europe Investment Banking Revenue (USD Million), by Applications (2023-2030)
11.4 Asia Pacific Investment Banking Revenue (USD Million) by Type, and Applications (2023-2030)
11.4.1 Asia Pacific Investment Banking Revenue (USD Million), by Country (2023-2030)
11.4.2 Asia Pacific Investment Banking Revenue (USD Million), by Type (2023-2030)
11.4.3 Asia Pacific Investment Banking Revenue (USD Million), by Applications (2023-2030)
11.5 South America Investment Banking Revenue (USD Million), by Type, and Applications (2023-2030)
11.5.1 South America Investment Banking Revenue (USD Million), by Country (2023-2030)
11.5.2 South America Investment Banking Revenue (USD Million), by Type (2023-2030)
11.5.3 South America Investment Banking Revenue (USD Million), by Applications (2023-2030)
11.6 Middle East and Africa Investment Banking Revenue (USD Million), by Type, and Applications (2023-2030)
11.6.1 Middle East and Africa Investment Banking Revenue (USD Million), by Region (2023-2030)
11.6.2 Middle East and Africa Investment Banking Revenue (USD Million), by Type (2023-2030)
11.6.3 Middle East and Africa Investment Banking Revenue (USD Million), by Applications (2023-2030)
12 Methodology and Data Sources
12.1 Methodology/Research Approach
12.1.1 Research Programs/Design
12.1.2 Market Size Estimation
12.1.3 Market Breakdown and Data Triangulation
12.2 Data Sources
12.2.1 Secondary Sources
12.2.2 Primary Sources
12.3 Disclaimer
List of Tables
Table 1 Market Segmentation Analysis
Table 2 Global Investment Banking Market Companies with Areas Served
Table 3 Products Offerings Global Investment Banking Market
Table 4 Low Growth Scenario Forecasts
Table 5 Reference Case Growth Scenario
Table 6 High Growth Case Scenario
Table 7 Global Investment Banking Revenue (USD Million) And CAGR (%) By Type (2018-2030)
Table 8 Global Investment Banking Revenue (USD Million) And CAGR (%) By Applications (2018-2030)
Table 9 Global Investment Banking Revenue (USD Million) And CAGR (%) By Regions (2018-2030)
Table 10 Global Investment Banking Revenue (USD Million) By Type (2018-2022)
Table 11 Global Investment Banking Revenue Market Share (%) By Type (2018-2022)
Table 12 Global Investment Banking Revenue (USD Million) By Applications (2018-2022)
Table 13 Global Investment Banking Revenue Market Share (%) By Applications (2018-2022)
Table 14 Global Investment Banking Market Revenue (USD Million) By Regions (2018-2022)
Table 15 Global Investment Banking Market Share (%) By Regions (2018-2022)
Table 16 North America Investment Banking Revenue (USD Million) By Country (2018-2022)
Table 17 North America Investment Banking Revenue (USD Million) By Type (2018-2022)
Table 18 North America Investment Banking Revenue (USD Million) By Applications (2018-2022)
Table 19 Europe Investment Banking Revenue (USD Million) By Country (2018-2022)
Table 20 Europe Investment Banking Revenue (USD Million) By Type (2018-2022)
Table 21 Europe Investment Banking Revenue (USD Million) By Applications (2018-2022)
Table 22 Asia Pacific Investment Banking Revenue (USD Million) By Country (2018-2022)
Table 23 Asia Pacific Investment Banking Revenue (USD Million) By Type (2018-2022)
Table 24 Asia Pacific Investment Banking Revenue (USD Million) By Applications (2018-2022)
Table 25 South America Investment Banking Revenue (USD Million) By Country (2018-2022)
Table 26 South America Investment Banking Revenue (USD Million) By Type (2018-2022)
Table 27 South America Investment Banking Revenue (USD Million) By Applications (2018-2022)
Table 28 Middle East and Africa Investment Banking Revenue (USD Million) By Region (2018-2022)
Table 29 Middle East and Africa Investment Banking Revenue (USD Million) By Type (2018-2022)
Table 30 Middle East and Africa Investment Banking Revenue (USD Million) By Applications (2018-2022)
Table 31 Financial Analysis
Table 32 Global Investment Banking Revenue (USD Million) By Type (2023-2030)
Table 33 Global Investment Banking Revenue Market Share (%) By Type (2023-2030)
Table 34 Global Investment Banking Revenue (USD Million) By Applications (2023-2030)
Table 35 Global Investment Banking Revenue Market Share (%) By Applications (2023-2030)
Table 36 Global Investment Banking Market Revenue (USD Million), And Revenue (USD Million) By Regions (2023-2030)
Table 37 North America Investment Banking Revenue (USD)By Country (2023-2030)
Table 38 North America Investment Banking Revenue (USD Million) By Type (2023-2030)
Table 39 North America Investment Banking Revenue (USD Million) By Applications (2023-2030)
Table 40 Europe Investment Banking Revenue (USD Million) By Country (2023-2030)
Table 41 Europe Investment Banking Revenue (USD Million) By Type (2023-2030)
Table 42 Europe Investment Banking Revenue (USD Million) By Applications (2023-2030)
Table 43 Asia Pacific Investment Banking Revenue (USD Million) By Country (2023-2030)
Table 44 Asia Pacific Investment Banking Revenue (USD Million) By Type (2023-2030)
Table 45 Asia Pacific Investment Banking Revenue (USD Million) By Applications (2023-2030)
Table 46 South America Investment Banking Revenue (USD Million) By Country (2023-2030)
Table 47 South America Investment Banking Revenue (USD Million) By Type (2023-2030)
Table 48 South America Investment Banking Revenue (USD Million) By Applications (2023-2030)
Table 49 Middle East and Africa Investment Banking Revenue (USD Million) By Region (2023-2030)
Table 50 Middle East and Africa Investment Banking Revenue (USD Million) By Region (2023-2030)
Table 51 Middle East and Africa Investment Banking Revenue (USD Million) By Type (2023-2030)
Table 52 Middle East and Africa Investment Banking Revenue (USD Million) By Applications (2023-2030)
Table 53 Research Programs/Design for This Report
Table 54 Key Data Information from Secondary Sources
Table 55 Key Data Information from Primary Sources
List of Figures
Figure 1 Market Scope
Figure 2 Porter’s Five Forces
Figure 3 Global Investment Banking Revenue (USD Million) By Type (2018-2022)
Figure 4 Global Investment Banking Revenue Market Share (%) By Type (2022)
Figure 5 Global Investment Banking Revenue (USD Million) By Applications (2018-2022)
Figure 6 Global Investment Banking Revenue Market Share (%) By Applications (2022)
Figure 7 Global Investment Banking Market Revenue (USD Million) By Regions (2018-2022)
Figure 8 Global Investment Banking Market Share (%) By Regions (2022)
Figure 9 North America Investment Banking Revenue (USD Million) By Country (2018-2022)
Figure 10 North America Investment Banking Revenue (USD Million) By Type (2018-2022)
Figure 11 North America Investment Banking Revenue (USD Million) By Applications (2018-2022)
Figure 12 Europe Investment Banking Revenue (USD Million) By Country (2018-2022)
Figure 13 Europe Investment Banking Revenue (USD Million) By Type (2018-2022)
Figure 14 Europe Investment Banking Revenue (USD Million) By Applications (2018-2022)
Figure 15 Asia Pacific Investment Banking Revenue (USD Million) By Country (2018-2022)
Figure 16 Asia Pacific Investment Banking Revenue (USD Million) By Type (2018-2022)
Figure 17 Asia Pacific Investment Banking Revenue (USD Million) By Applications (2018-2022)
Figure 18 South America Investment Banking Revenue (USD Million) By Country (2018-2022)
Figure 19 South America Investment Banking Revenue (USD Million) By Type (2018-2022)
Figure 20 South America Investment Banking Revenue (USD Million) By Applications (2018-2022)
Figure 21 Middle East and Africa Investment Banking Revenue (USD Million) By Region (2018-2022)
Figure 22 Middle East and Africa Investment Banking Revenue (USD Million) By Type (2018-2022)
Figure 23 Middle East and Africa Investment Banking Revenue (USD Million) By Applications (2018-2022)
Figure 24 Global Investment Banking Revenue (USD Million) By Type (2023-2030)
Figure 25 Global Investment Banking Revenue Market Share (%) By Type (2030)
Figure 26 Global Investment Banking Revenue (USD Million) By Applications (2023-2030)
Figure 27 Global Investment Banking Revenue Market Share (%) By Applications (2030)
Figure 28 Global Investment Banking Market Revenue (USD Million) By Regions (2023-2030)
Figure 29 North America Investment Banking Revenue (USD Million) By Country (2023-2030)
Figure 30 North America Investment Banking Revenue (USD Million) By Type (2023-2030)
Figure 31 North America Investment Banking Revenue (USD Million) By Applications (2023-2030)
Figure 32 Europe Investment Banking Revenue (USD Million) By Country (2023-2030)
Figure 33 Europe Investment Banking Revenue (USD Million) By Type (2023-2030)
Figure 34 Europe Investment Banking Revenue (USD Million) By Applications (2023-2030)
Figure 35 Asia Pacific Investment Banking Revenue (USD Million) By Country (2023-2030)
Figure 36 Asia Pacific Investment Banking Revenue (USD Million) By Type (2023-2030)
Figure 37 Asia Pacific Investment Banking Revenue (USD Million) By Applications (2023-2030)
Figure 38 South America Investment Banking Revenue (USD Million) By Country (2023-2030)
Figure 39 South America Investment Banking Revenue (USD Million) By Type (2023-2030)
Figure 40 South America Investment Banking Revenue (USD Million) By Applications (2023-2030)
Figure 41 Middle East and Africa Investment Banking Revenue (USD Million) By Region (2023-2030)
Figure 42 Middle East and Africa Investment Banking Revenue (USD Million) By Region (2023-2030)
Figure 43 Middle East and Africa Investment Banking Revenue (USD Million) By Type (2023-2030)
Figure 44 Middle East and Africa Investment Banking Revenue (USD Million) By Applications (2023-2030)
Figure 45 Bottom-Up and Top-Down Approaches For This Report
Figure 46 Data Triangulation
By Type
By Enterprise Size
By End-User
By Region