
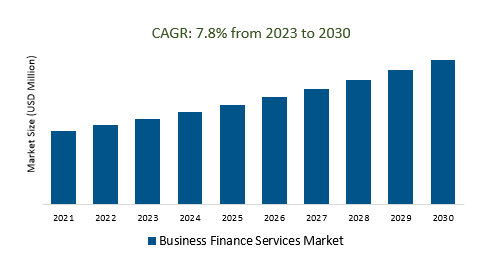
The Global Business Finance Services Market Size is estimated to register 7,8% growth over the forecast period from 2023 to 2030.
The market growth is driven by the increasing focus on environmental, social, and governance (ESG) criteria in financial products and services. Leading companies that are focused on Digital Transformation, Fintech Innovation, AI and Data Analytics, Blockchain and Cryptocurrency, Cybersecurity and Data Privacy, Partnerships and Collaborations, and others to boost market shares in the industry.
The business finance services market comprises a wide array of financial offerings, including traditional banking, fintech innovations, investment services, and insurance solutions, vital for businesses. Key trends include digital transformation, alternative lending via fintech, blockchain adoption, and sustainable finance. Major players include traditional banks, fintech startups, investment banks, and insurance companies. Challenges encompass regulatory compliance, cybersecurity, and economic conditions. The market outlook varies globally, with mature economies and emerging markets having distinct dynamics.
Data analytics and AI are driving innovation in the business finance services market, empowering traditional and fintech players to improve decision-making, streamline operations, and offer tailored services. These technologies enable enhanced risk assessment, fraud detection, and predictive modeling, ultimately creating a more efficient and competitive landscape that better meets the financial needs of businesses.
The demand for mobile banking and payments in the business finance services market is driven by their unparalleled convenience, cost efficiency, and security, with businesses of all sizes seeking to meet customer expectations. These services offer global accessibility, seamless integration with financial software, valuable data insights, and continuous innovation while requiring compliance with financial regulations, positioning them as essential tools for businesses aiming to streamline financial operations and stay competitive.
Technological advancements in the business finance services market have catalyzed significant transformations. Innovations like blockchain technology have improved security and transparency in financial transactions, while AI and machine learning enhance risk assessment and fraud detection. Fintech startups have disrupted traditional banking with user-friendly mobile apps and digital payment solutions.
The Global Business Finance Services Market is analyzed across Onsite, Offsite, and others. Offsite is poised to register the fastest growth. Offsite in the business finance services market refers to conducting financial operations and services outside a company's physical location, often facilitated through cloud-based software, remote consulting, and outsourcing. This approach offers flexibility, cost savings, scalability, and access to specialized expertise while reducing the need for physical infrastructure and on-site staff, contributing to overall efficiency and competitiveness.
The Global Business Finance Services Market is analyzed across various applications including Accounting Services, Bookkeeping Services, Tax Services, Financial Consulting, and others. Of these, Bookkeeping Services held a significant market share in 2023. Bookkeeping services are vital in the business finance services market, offering precise financial record-keeping through income and expense tracking, invoice management, and tax compliance. These services employ technology for accuracy, error reduction, and efficient financial management, often through outsourcing or cloud-based solutions, providing businesses with cost-effective and reliable financial tracking and decision-making support.
By Type
By Application
By Region
*List not exhaustive
Business Finance Services Market Outlook 2023
1 Market Overview
1.1 Introduction to the Business Finance Services Market
1.2 Scope of the Study
1.3 Research Objective
1.3.1 Key Market Scope and Segments
1.3.2 Players Covered
1.3.3 Years Considered
2 Executive Summary
2.1 2023 Business Finance Services Industry- Market Statistics
3 Market Dynamics
3.1 Market Drivers
3.2 Market Challenges
3.3 Market Opportunities
3.4 Market Trends
4 Market Factor Analysis
4.1 Porter’s Five Forces
4.2 Market Entropy
4.2.1 Global Business Finance Services Market Companies with Area Served
4.2.2 Products Offerings Global Business Finance Services Market
5 COVID-19 Impact Analysis and Outlook Scenarios
5.1.1 Covid-19 Impact Analysis
5.1.2 post-COVID-19 Scenario- Low Growth Case
5.1.3 post-COVID-19 Scenario- Reference Growth Case
5.1.4 post-COVID-19 Scenario- Low Growth Case
6 Global Business Finance Services Market Trends
6.1 Global Business Finance Services Revenue (USD Million) and CAGR (%) by Type (2018-2030)
6.2 Global Business Finance Services Revenue (USD Million) and CAGR (%) by Applications (2018-2030)
6.3 Global Business Finance Services Revenue (USD Million) and CAGR (%) by regions (2018-2030)
7 Global Business Finance Services Market Revenue (USD Million) by Type, and Applications (2018-2022)
7.1 Global Business Finance Services Revenue (USD Million) by Type (2018-2022)
7.1.1 Global Business Finance Services Revenue (USD Million), Market Share (%) by Type (2018-2022)
7.2 Global Business Finance Services Revenue (USD Million) by Applications (2018-2022)
7.2.1 Global Business Finance Services Revenue (USD Million), Market Share (%) by Applications (2018-2022)
8 Global Business Finance Services Development Regional Status and Outlook
8.1 Global Business Finance Services Revenue (USD Million) By Regions (2018-2022)
8.2 North America Business Finance Services Revenue (USD Million) by Type, and Application (2018-2022)
8.2.1 North America Business Finance Services Revenue (USD Million) by Country (2018-2022)
8.2.2 North America Business Finance Services Revenue (USD Million) by Type (2018-2022)
8.2.3 North America Business Finance Services Revenue (USD Million) by Applications (2018-2022)
8.3 Europe Business Finance Services Revenue (USD Million), by Type, and Applications (USD Million) (2018-2022)
8.3.1 Europe Business Finance Services Revenue (USD Million), by Country (2018-2022)
8.3.2 Europe Business Finance Services Revenue (USD Million) by Type (2018-2022)
8.3.3 Europe Business Finance Services Revenue (USD Million) by Applications (2018-2022)
8.4 Asia Pacific Business Finance Services Revenue (USD Million), and Revenue (USD Million) by Type, and Applications (2018-2022)
8.4.1 Asia Pacific Business Finance Services Revenue (USD Million) by Country (2018-2022)
8.4.2 Asia Pacific Business Finance Services Revenue (USD Million) by Type (2018-2022)
8.4.3 Asia Pacific Business Finance Services Revenue (USD Million) by Applications (2018-2022)
8.5 South America Business Finance Services Revenue (USD Million), by Type, and Applications (2018-2022)
8.5.1 South America Business Finance Services Revenue (USD Million), by Country (2018-2022)
8.5.2 South America Business Finance Services Revenue (USD Million) by Type (2018-2022)
8.5.3 South America Business Finance Services Revenue (USD Million) by Applications (2018-2022)
8.6 Middle East and Africa Business Finance Services Revenue (USD Million), by Type, Technology, Application, Thickness (2018-2022)
8.6.1 Middle East and Africa Business Finance Services Revenue (USD Million) by Country (2018-2022)
8.6.2 Middle East and Africa Business Finance Services Revenue (USD Million) by Type (2018-2022)
8.6.3 Middle East and Africa Business Finance Services Revenue (USD Million) by Applications (2018-2022)
9 Company Profiles
10 Global Business Finance Services Market Revenue (USD Million), by Type, and Applications (2023-2030)
10.1 Global Business Finance Services Revenue (USD Million) and Market Share (%) by Type (2023-2030)
10.1.1 Global Business Finance Services Revenue (USD Million), and Market Share (%) by Type (2023-2030)
10.2 Global Business Finance Services Revenue (USD Million) and Market Share (%) by Applications (2023-2030)
10.2.1 Global Business Finance Services Revenue (USD Million), and Market Share (%) by Applications (2023-2030)
11 Global Business Finance Services Development Regional Status and Outlook Forecast
11.1 Global Business Finance Services Revenue (USD Million) By Regions (2023-2030)
11.2 North America Business Finance Services Revenue (USD Million) by Type, and Applications (2023-2030)
11.2.1 North America Business Finance Services Revenue (USD) Million by Country (2023-2030)
11.2.2 North America Business Finance Services Revenue (USD Million), by Type (2023-2030)
11.2.3 North America Business Finance Services Revenue (USD Million), Market Share (%) by Applications (2023-2030)
11.3 Europe Business Finance Services Revenue (USD Million), by Type, and Applications (2023-2030)
11.3.1 Europe Business Finance Services Revenue (USD Million), by Country (2023-2030)
11.3.2 Europe Business Finance Services Revenue (USD Million), by Type (2023-2030)
11.3.3 Europe Business Finance Services Revenue (USD Million), by Applications (2023-2030)
11.4 Asia Pacific Business Finance Services Revenue (USD Million) by Type, and Applications (2023-2030)
11.4.1 Asia Pacific Business Finance Services Revenue (USD Million), by Country (2023-2030)
11.4.2 Asia Pacific Business Finance Services Revenue (USD Million), by Type (2023-2030)
11.4.3 Asia Pacific Business Finance Services Revenue (USD Million), by Applications (2023-2030)
11.5 South America Business Finance Services Revenue (USD Million), by Type, and Applications (2023-2030)
11.5.1 South America Business Finance Services Revenue (USD Million), by Country (2023-2030)
11.5.2 South America Business Finance Services Revenue (USD Million), by Type (2023-2030)
11.5.3 South America Business Finance Services Revenue (USD Million), by Applications (2023-2030)
11.6 Middle East and Africa Business Finance Services Revenue (USD Million), by Type, and Applications (2023-2030)
11.6.1 Middle East and Africa Business Finance Services Revenue (USD Million), by region (2023-2030)
11.6.2 Middle East and Africa Business Finance Services Revenue (USD Million), by Type (2023-2030)
11.6.3 Middle East and Africa Business Finance Services Revenue (USD Million), by Applications (2023-2030)
12 Methodology and Data Sources
12.1 Methodology/Research Approach
12.1.1 Research Programs/Design
12.1.2 Market Size Estimation
12.1.3 Market Breakdown and Data Triangulation
12.2 Data Sources
12.2.1 Secondary Sources
12.2.2 Primary Sources
12.3 Disclaimer
List of Tables
Table 1 Market Segmentation Analysis
Table 2 Global Business Finance Services Market Companies with Areas Served
Table 3 Products Offerings Global Business Finance Services Market
Table 4 Low Growth Scenario Forecasts
Table 5 Reference Case Growth Scenario
Table 6 High Growth Case Scenario
Table 7 Global Business Finance Services Revenue (USD Million) And CAGR (%) By Type (2018-2030)
Table 8 Global Business Finance Services Revenue (USD Million) And CAGR (%) By Applications (2018-2030)
Table 9 Global Business Finance Services Revenue (USD Million) And CAGR (%) By Regions (2018-2030)
Table 10 Global Business Finance Services Revenue (USD Million) By Type (2018-2022)
Table 11 Global Business Finance Services Revenue Market Share (%) By Type (2018-2022)
Table 12 Global Business Finance Services Revenue (USD Million) By Applications (2018-2022)
Table 13 Global Business Finance Services Revenue Market Share (%) By Applications (2018-2022)
Table 14 Global Business Finance Services Market Revenue (USD Million) By Regions (2018-2022)
Table 15 Global Business Finance Services Market Share (%) By Regions (2018-2022)
Table 16 North America Business Finance Services Revenue (USD Million) By Country (2018-2022)
Table 17 North America Business Finance Services Revenue (USD Million) By Type (2018-2022)
Table 18 North America Business Finance Services Revenue (USD Million) By Applications (2018-2022)
Table 19 Europe Business Finance Services Revenue (USD Million) By Country (2018-2022)
Table 20 Europe Business Finance Services Revenue (USD Million) By Type (2018-2022)
Table 21 Europe Business Finance Services Revenue (USD Million) By Applications (2018-2022)
Table 22 Asia Pacific Business Finance Services Revenue (USD Million) By Country (2018-2022)
Table 23 Asia Pacific Business Finance Services Revenue (USD Million) By Type (2018-2022)
Table 24 Asia Pacific Business Finance Services Revenue (USD Million) By Applications (2018-2022)
Table 25 South America Business Finance Services Revenue (USD Million) By Country (2018-2022)
Table 26 South America Business Finance Services Revenue (USD Million) By Type (2018-2022)
Table 27 South America Business Finance Services Revenue (USD Million) By Applications (2018-2022)
Table 28 Middle East and Africa Business Finance Services Revenue (USD Million) By Region (2018-2022)
Table 29 Middle East and Africa Business Finance Services Revenue (USD Million) By Type (2018-2022)
Table 30 Middle East and Africa Business Finance Services Revenue (USD Million) By Applications (2018-2022)
Table 31 Financial Analysis
Table 32 Global Business Finance Services Revenue (USD Million) By Type (2023-2030)
Table 33 Global Business Finance Services Revenue Market Share (%) By Type (2023-2030)
Table 34 Global Business Finance Services Revenue (USD Million) By Applications (2023-2030)
Table 35 Global Business Finance Services Revenue Market Share (%) By Applications (2023-2030)
Table 36 Global Business Finance Services Market Revenue (USD Million), And Revenue (USD Million) By Regions (2023-2030)
Table 37 North America Business Finance Services Revenue (USD)By Country (2023-2030)
Table 38 North America Business Finance Services Revenue (USD Million) By Type (2023-2030)
Table 39 North America Business Finance Services Revenue (USD Million) By Applications (2023-2030)
Table 40 Europe Business Finance Services Revenue (USD Million) By Country (2023-2030)
Table 41 Europe Business Finance Services Revenue (USD Million) By Type (2023-2030)
Table 42 Europe Business Finance Services Revenue (USD Million) By Applications (2023-2030)
Table 43 Asia Pacific Business Finance Services Revenue (USD Million) By Country (2023-2030)
Table 44 Asia Pacific Business Finance Services Revenue (USD Million) By Type (2023-2030)
Table 45 Asia Pacific Business Finance Services Revenue (USD Million) By Applications (2023-2030)
Table 46 South America Business Finance Services Revenue (USD Million) By Country (2023-2030)
Table 47 South America Business Finance Services Revenue (USD Million) By Type (2023-2030)
Table 48 South America Business Finance Services Revenue (USD Million) By Applications (2023-2030)
Table 49 Middle East and Africa Business Finance Services Revenue (USD Million) By Region (2023-2030)
Table 50 Middle East and Africa Business Finance Services Revenue (USD Million) By Region (2023-2030)
Table 51 Middle East and Africa Business Finance Services Revenue (USD Million) By Type (2023-2030)
Table 52 Middle East and Africa Business Finance Services Revenue (USD Million) By Applications (2023-2030)
Table 53 Research Programs/Design for This Report
Table 54 Key Data Information from Secondary Sources
Table 55 Key Data Information from Primary Sources
List of Figures
Figure 1 Market Scope
Figure 2 Porter’s Five Forces
Figure 3 Global Business Finance Services Revenue (USD Million) By Type (2018-2022)
Figure 4 Global Business Finance Services Revenue Market Share (%) By Type (2022)
Figure 5 Global Business Finance Services Revenue (USD Million) By Applications (2018-2022)
Figure 6 Global Business Finance Services Revenue Market Share (%) By Applications (2022)
Figure 7 Global Business Finance Services Market Revenue (USD Million) By Regions (2018-2022)
Figure 8 Global Business Finance Services Market Share (%) By Regions (2022)
Figure 9 North America Business Finance Services Revenue (USD Million) By Country (2018-2022)
Figure 10 North America Business Finance Services Revenue (USD Million) By Type (2018-2022)
Figure 11 North America Business Finance Services Revenue (USD Million) By Applications (2018-2022)
Figure 12 Europe Business Finance Services Revenue (USD Million) By Country (2018-2022)
Figure 13 Europe Business Finance Services Revenue (USD Million) By Type (2018-2022)
Figure 14 Europe Business Finance Services Revenue (USD Million) By Applications (2018-2022)
Figure 15 Asia Pacific Business Finance Services Revenue (USD Million) By Country (2018-2022)
Figure 16 Asia Pacific Business Finance Services Revenue (USD Million) By Type (2018-2022)
Figure 17 Asia Pacific Business Finance Services Revenue (USD Million) By Applications (2018-2022)
Figure 18 South America Business Finance Services Revenue (USD Million) By Country (2018-2022)
Figure 19 South America Business Finance Services Revenue (USD Million) By Type (2018-2022)
Figure 20 South America Business Finance Services Revenue (USD Million) By Applications (2018-2022)
Figure 21 Middle East and Africa Business Finance Services Revenue (USD Million) By Region (2018-2022)
Figure 22 Middle East and Africa Business Finance Services Revenue (USD Million) By Type (2018-2022)
Figure 23 Middle East and Africa Business Finance Services Revenue (USD Million) By Applications (2018-2022)
Figure 24 Global Business Finance Services Revenue (USD Million) By Type (2023-2030)
Figure 25 Global Business Finance Services Revenue Market Share (%) By Type (2030)
Figure 26 Global Business Finance Services Revenue (USD Million) By Applications (2023-2030)
Figure 27 Global Business Finance Services Revenue Market Share (%) By Applications (2030)
Figure 28 Global Business Finance Services Market Revenue (USD Million) By Regions (2023-2030)
Figure 29 North America Business Finance Services Revenue (USD Million) By Country (2023-2030)
Figure 30 North America Business Finance Services Revenue (USD Million) By Type (2023-2030)
Figure 31 North America Business Finance Services Revenue (USD Million) By Applications (2023-2030)
Figure 32 Europe Business Finance Services Revenue (USD Million) By Country (2023-2030)
Figure 33 Europe Business Finance Services Revenue (USD Million) By Type (2023-2030)
Figure 34 Europe Business Finance Services Revenue (USD Million) By Applications (2023-2030)
Figure 35 Asia Pacific Business Finance Services Revenue (USD Million) By Country (2023-2030)
Figure 36 Asia Pacific Business Finance Services Revenue (USD Million) By Type (2023-2030)
Figure 37 Asia Pacific Business Finance Services Revenue (USD Million) By Applications (2023-2030)
Figure 38 South America Business Finance Services Revenue (USD Million) By Country (2023-2030)
Figure 39 South America Business Finance Services Revenue (USD Million) By Type (2023-2030)
Figure 40 South America Business Finance Services Revenue (USD Million) By Applications (2023-2030)
Figure 41 Middle East and Africa Business Finance Services Revenue (USD Million) By Region (2023-2030)
Figure 42 Middle East and Africa Business Finance Services Revenue (USD Million) By Region (2023-2030)
Figure 43 Middle East and Africa Business Finance Services Revenue (USD Million) By Type (2023-2030)
Figure 44 Middle East and Africa Business Finance Services Revenue (USD Million) By Applications (2023-2030)
Figure 45 Bottom-Up and Top-Down Approaches for This Report
Figure 46 Data Triangulation
By Type
By Application
By Region