
The global XX study analyzes and forecasts the market size across 6 regions and 24 countries for diverse segments including- By Type(Business Process Outsourcing, Infrastructure and Operations Services), By End-User (BFSI, Healthcare, Manufacturing, IT and Telecommunications, Retail, Others)
The market's growth is driven by organizations that are increasingly outsourcing services to support their digital transformation initiatives. BPO and ITO service providers are focusing on enabling remote work capabilities to ensure business continuity. Furthermore, these providers are making substantial investments in robust cybersecurity measures. Automation technologies and artificial intelligence are being increasingly integrated into BPO and ITO services to enhance efficiency, reduce costs, and improve the quality of service delivery.
BPO and ITO providers are also developing industry-specific solutions to meet the unique needs and compliance requirements of different sectors, including healthcare, finance, and telecommunications. Additionally, they are incorporating eco-friendly practices and emphasizing green initiatives to align with clients' corporate social responsibility goals. This holistic approach reflects a broader trend in the industry toward sustainable and specialized solutions to address the evolving needs of organizations in various sectors.
The rising trend of organizations outsourcing services to facilitate their digital transformation initiatives has become a pivotal driver in the market. The flexibility and scalability offered by outsourcing are crucial contributors to the market's growth. Organizations can seamlessly scale their digital transformation initiatives up or down, responding to changing needs without the complexities of hiring or downsizing an in-house team. The outsourcing of digital transformation services serves as a catalyst for innovation, efficiency, and competitiveness in the evolving business landscape. It enables organizations to navigate the complexities of modern technologies, leverage external expertise, optimize costs, and focus on their core strengths. All of these factors collectively contribute to the robust growth of the market.
The surge in remote work, catalyzed by the COVID-19 pandemic, has emerged as a pivotal driver influencing the Business Process Outsourcing (BPO) and Information Technology Outsourcing (ITO) services market. The acceleration of remote work adoption, triggered by the COVID-19 pandemic, has become a transformative force in the BPO and ITO services market. The strategic focus on enabling remote work capabilities reflects a forward-thinking approach by service providers, aligning their offerings with the evolving needs of businesses in a rapidly changing work landscape. This trend is not only responding to immediate challenges but is also reshaping the market by redefining expectations for business continuity, flexibility, and security in the post-pandemic era.
The development of industry-specific solutions by Business Process Outsourcing (BPO) and Information Technology Outsourcing (ITO) providers represents a strategic move that significantly drives the market. The creation of industry-specific solutions is a market driver as it enhances the relevance and effectiveness of outsourcing services. By tailoring their offerings to the unique demands of various industries, BPO and ITO providers position themselves as strategic partners capable of delivering specialized, compliant, and innovative solutions that contribute to the growth and success of businesses within specific sectors.
Business Process Outsourcing (BPO) is the fastest-growing service type across Business Process Outsourcing, Infrastructure and Operations Services. Businesses are increasingly focusing on their core competencies and outsourcing non-core activities to specialized service providers. This allows businesses to concentrate on their areas of expertise and achieve greater efficiency and effectiveness. BPO providers can often offer economies of scale and specialized expertise that businesses cannot easily replicate internally. BPO can help businesses reduce costs by providing access to lower-cost labor, eliminating the need to invest in infrastructure and technology, and improving operational efficiency. Businesses can also save money by outsourcing non-core activities that they are not as proficient at performing as specialized service providers.
BFSI (Banking, Financial Services, and Insurance) has the largest market size across BFSI, Healthcare, Manufacturing, IT and Telecommunications, Retail, Others. The financial services industry plays a crucial role in the global economy by enabling individuals and businesses to manage their finances, facilitate transactions, and invest for long-term growth. This growing importance stems from the increasing demand for financial products and services, the rising complexity of financial regulations, and the necessity for financial institutions to invest in technology and innovations.
|
Parameter |
Details |
|
Market Size (2024) |
$294.3 Billion |
|
Market Size (2034) |
$653.2 Billion |
|
Market Growth Rate |
8.3% |
|
Segments |
By Type (Business Process Outsourcing, Infrastructure and Operations Services), By End-User (BFSI, Healthcare, Manufacturing, IT and Telecommunications, Retail, Others) |
|
Study Period |
2019- 2024 and 2025-2034 |
|
Units |
Revenue (USD) |
|
Qualitative Analysis |
Porter’s Five Forces, SWOT Profile, Market Share, Scenario Forecasts, Market Ecosystem, Company Ranking, Market Dynamics, Industry Benchmarking |
|
Companies |
Accenture, Capgemini, Cognizant, Concentrix, Genpact, HCL Technologies, Helpware, IBM, Infosys Technologies, Intetics, Octopus Tech, Plaxonic Technologies, Sciencesoft, Sodexo, SunTec India, TCS, Unity Communications, Wipro Technologies, and Others. |
|
Countries |
US, Canada, Mexico, Germany, France, Spain, Italy, UK, Russia, China, India, Japan, South Korea, Australia, South East Asia, Brazil, Argentina, Middle East, Africa |
By Type
By End-User
By Region
*List not exhaustive
BPO and ITO Services Market Outlook 2023
1 Market Overview
1.1 Introduction to the BPO and ITO Services Market
1.2 Scope of the Study
1.3 Research Objective
1.3.1 Key Market Scope and Segments
1.3.2 Players Covered
1.3.3 Years Considered
2 Executive Summary
2.1 2023 BPO and ITO Services Industry- Market Statistics
3 Market Dynamics
3.1 Market Drivers
3.2 Market Challenges
3.3 Market Opportunities
3.4 Market Trends
4 Market Factor Analysis
4.1 Porter’s Five Forces
4.2 Market Entropy
4.2.1 Global BPO and ITO Services Market Companies with Area Served
4.2.2 Products Offerings Global BPO and ITO Services Market
5 COVID-19 Impact Analysis and Outlook Scenarios
5.1.1 Covid-19 Impact Analysis
5.1.2 post-COVID-19 Scenario- Low Growth Case
5.1.3 post-COVID-19 Scenario- Reference Growth Case
5.1.4 post-COVID-19 Scenario- Low Growth Case
6 Global BPO and ITO Services Market Trends
6.1 Global BPO and ITO Services Revenue (USD Million) and CAGR (%) by Type (2018-2030)
6.2 Global BPO and ITO Services Revenue (USD Million) and CAGR (%) by Applications (2018-2030)
6.3 Global BPO and ITO Services Revenue (USD Million) and CAGR (%) by regions (2018-2030)
7 Global BPO and ITO Services Market Revenue (USD Million) by Type, and Applications (2018-2022)
7.1 Global BPO and ITO Services Revenue (USD Million) by Type (2018-2022)
7.1.1 Global BPO and ITO Services Revenue (USD Million), Market Share (%) by Type (2018-2022)
7.2 Global BPO and ITO Services Revenue (USD Million) by Applications (2018-2022)
7.2.1 Global BPO and ITO Services Revenue (USD Million), Market Share (%) by Applications (2018-2022)
8 Global BPO and ITO Services Development Regional Status and Outlook
8.1 Global BPO and ITO Services Revenue (USD Million) By Regions (2018-2022)
8.2 North America BPO and ITO Services Revenue (USD Million) by Type, and Application (2018-2022)
8.2.1 North America BPO and ITO Services Revenue (USD Million) by Country (2018-2022)
8.2.2 North America BPO and ITO Services Revenue (USD Million) by Type (2018-2022)
8.2.3 North America BPO and ITO Services Revenue (USD Million) by Applications (2018-2022)
8.3 Europe BPO and ITO Services Revenue (USD Million), by Type, and Applications (USD Million) (2018-2022)
8.3.1 Europe BPO and ITO Services Revenue (USD Million), by Country (2018-2022)
8.3.2 Europe BPO and ITO Services Revenue (USD Million) by Type (2018-2022)
8.3.3 Europe BPO and ITO Services Revenue (USD Million) by Applications (2018-2022)
8.4 Asia Pacific BPO and ITO Services Revenue (USD Million), and Revenue (USD Million) by Type, and Applications (2018-2022)
8.4.1 Asia Pacific BPO and ITO Services Revenue (USD Million) by Country (2018-2022)
8.4.2 Asia Pacific BPO and ITO Services Revenue (USD Million) by Type (2018-2022)
8.4.3 Asia Pacific BPO and ITO Services Revenue (USD Million) by Applications (2018-2022)
8.5 South America BPO and ITO Services Revenue (USD Million), by Type, and Applications (2018-2022)
8.5.1 South America BPO and ITO Services Revenue (USD Million), by Country (2018-2022)
8.5.2 South America BPO and ITO Services Revenue (USD Million) by Type (2018-2022)
8.5.3 South America BPO and ITO Services Revenue (USD Million) by Applications (2018-2022)
8.6 Middle East and Africa BPO and ITO Services Revenue (USD Million), by Type, Technology, Application, Thickness (2018-2022)
8.6.1 Middle East and Africa BPO and ITO Services Revenue (USD Million) by Country (2018-2022)
8.6.2 Middle East and Africa BPO and ITO Services Revenue (USD Million) by Type (2018-2022)
8.6.3 Middle East and Africa BPO and ITO Services Revenue (USD Million) by Applications (2018-2022)
9 Company Profiles
10 Global BPO and ITO Services Market Revenue (USD Million), by Type, and Applications (2023-2030)
10.1 Global BPO and ITO Services Revenue (USD Million) and Market Share (%) by Type (2023-2030)
10.1.1 Global BPO and ITO Services Revenue (USD Million), and Market Share (%) by Type (2023-2030)
10.2 Global BPO and ITO Services Revenue (USD Million) and Market Share (%) by Applications (2023-2030)
10.2.1 Global BPO and ITO Services Revenue (USD Million), and Market Share (%) by Applications (2023-2030)
11 Global BPO and ITO Services Development Regional Status and Outlook Forecast
11.1 Global BPO and ITO Services Revenue (USD Million) By Regions (2023-2030)
11.2 North America BPO and ITO Services Revenue (USD Million) by Type, and Applications (2023-2030)
11.2.1 North America BPO and ITO Services Revenue (USD) Million by Country (2023-2030)
11.2.2 North America BPO and ITO Services Revenue (USD Million), by Type (2023-2030)
11.2.3 North America BPO and ITO Services Revenue (USD Million), Market Share (%) by Applications (2023-2030)
11.3 Europe BPO and ITO Services Revenue (USD Million), by Type, and Applications (2023-2030)
11.3.1 Europe BPO and ITO Services Revenue (USD Million), by Country (2023-2030)
11.3.2 Europe BPO and ITO Services Revenue (USD Million), by Type (2023-2030)
11.3.3 Europe BPO and ITO Services Revenue (USD Million), by Applications (2023-2030)
11.4 Asia Pacific BPO and ITO Services Revenue (USD Million) by Type, and Applications (2023-2030)
11.4.1 Asia Pacific BPO and ITO Services Revenue (USD Million), by Country (2023-2030)
11.4.2 Asia Pacific BPO and ITO Services Revenue (USD Million), by Type (2023-2030)
11.4.3 Asia Pacific BPO and ITO Services Revenue (USD Million), by Applications (2023-2030)
11.5 South America BPO and ITO Services Revenue (USD Million), by Type, and Applications (2023-2030)
11.5.1 South America BPO and ITO Services Revenue (USD Million), by Country (2023-2030)
11.5.2 South America BPO and ITO Services Revenue (USD Million), by Type (2023-2030)
11.5.3 South America BPO and ITO Services Revenue (USD Million), by Applications (2023-2030)
11.6 Middle East and Africa BPO and ITO Services Revenue (USD Million), by Type, and Applications (2023-2030)
11.6.1 Middle East and Africa BPO and ITO Services Revenue (USD Million), by region (2023-2030)
11.6.2 Middle East and Africa BPO and ITO Services Revenue (USD Million), by Type (2023-2030)
11.6.3 Middle East and Africa BPO and ITO Services Revenue (USD Million), by Applications (2023-2030)
12 Methodology and Data Sources
12.1 Methodology/Research Approach
12.1.1 Research Programs/Design
12.1.2 Market Size Estimation
12.1.3 Market Breakdown and Data Triangulation
12.2 Data Sources
12.2.1 Secondary Sources
12.2.2 Primary Sources
12.3 Disclaimer
List of Tables
Table 1 Market Segmentation Analysis
Table 2 Global BPO and ITO Services Market Companies with Areas Served
Table 3 Products Offerings Global BPO and ITO Services Market
Table 4 Low Growth Scenario Forecasts
Table 5 Reference Case Growth Scenario
Table 6 High Growth Case Scenario
Table 7 Global BPO and ITO Services Revenue (USD Million) And CAGR (%) By Type (2018-2030)
Table 8 Global BPO and ITO Services Revenue (USD Million) And CAGR (%) By Applications (2018-2030)
Table 9 Global BPO and ITO Services Revenue (USD Million) And CAGR (%) By Regions (2018-2030)
Table 10 Global BPO and ITO Services Revenue (USD Million) By Type (2018-2022)
Table 11 Global BPO and ITO Services Revenue Market Share (%) By Type (2018-2022)
Table 12 Global BPO and ITO Services Revenue (USD Million) By Applications (2018-2022)
Table 13 Global BPO and ITO Services Revenue Market Share (%) By Applications (2018-2022)
Table 14 Global BPO and ITO Services Market Revenue (USD Million) By Regions (2018-2022)
Table 15 Global BPO and ITO Services Market Share (%) By Regions (2018-2022)
Table 16 North America BPO and ITO Services Revenue (USD Million) By Country (2018-2022)
Table 17 North America BPO and ITO Services Revenue (USD Million) By Type (2018-2022)
Table 18 North America BPO and ITO Services Revenue (USD Million) By Applications (2018-2022)
Table 19 Europe BPO and ITO Services Revenue (USD Million) By Country (2018-2022)
Table 20 Europe BPO and ITO Services Revenue (USD Million) By Type (2018-2022)
Table 21 Europe BPO and ITO Services Revenue (USD Million) By Applications (2018-2022)
Table 22 Asia Pacific BPO and ITO Services Revenue (USD Million) By Country (2018-2022)
Table 23 Asia Pacific BPO and ITO Services Revenue (USD Million) By Type (2018-2022)
Table 24 Asia Pacific BPO and ITO Services Revenue (USD Million) By Applications (2018-2022)
Table 25 South America BPO and ITO Services Revenue (USD Million) By Country (2018-2022)
Table 26 South America BPO and ITO Services Revenue (USD Million) By Type (2018-2022)
Table 27 South America BPO and ITO Services Revenue (USD Million) By Applications (2018-2022)
Table 28 Middle East and Africa BPO and ITO Services Revenue (USD Million) By Region (2018-2022)
Table 29 Middle East and Africa BPO and ITO Services Revenue (USD Million) By Type (2018-2022)
Table 30 Middle East and Africa BPO and ITO Services Revenue (USD Million) By Applications (2018-2022)
Table 31 Financial Analysis
Table 32 Global BPO and ITO Services Revenue (USD Million) By Type (2023-2030)
Table 33 Global BPO and ITO Services Revenue Market Share (%) By Type (2023-2030)
Table 34 Global BPO and ITO Services Revenue (USD Million) By Applications (2023-2030)
Table 35 Global BPO and ITO Services Revenue Market Share (%) By Applications (2023-2030)
Table 36 Global BPO and ITO Services Market Revenue (USD Million), And Revenue (USD Million) By Regions (2023-2030)
Table 37 North America BPO and ITO Services Revenue (USD)By Country (2023-2030)
Table 38 North America BPO and ITO Services Revenue (USD Million) By Type (2023-2030)
Table 39 North America BPO and ITO Services Revenue (USD Million) By Applications (2023-2030)
Table 40 Europe BPO and ITO Services Revenue (USD Million) By Country (2023-2030)
Table 41 Europe BPO and ITO Services Revenue (USD Million) By Type (2023-2030)
Table 42 Europe BPO and ITO Services Revenue (USD Million) By Applications (2023-2030)
Table 43 Asia Pacific BPO and ITO Services Revenue (USD Million) By Country (2023-2030)
Table 44 Asia Pacific BPO and ITO Services Revenue (USD Million) By Type (2023-2030)
Table 45 Asia Pacific BPO and ITO Services Revenue (USD Million) By Applications (2023-2030)
Table 46 South America BPO and ITO Services Revenue (USD Million) By Country (2023-2030)
Table 47 South America BPO and ITO Services Revenue (USD Million) By Type (2023-2030)
Table 48 South America BPO and ITO Services Revenue (USD Million) By Applications (2023-2030)
Table 49 Middle East and Africa BPO and ITO Services Revenue (USD Million) By Region (2023-2030)
Table 50 Middle East and Africa BPO and ITO Services Revenue (USD Million) By Region (2023-2030)
Table 51 Middle East and Africa BPO and ITO Services Revenue (USD Million) By Type (2023-2030)
Table 52 Middle East and Africa BPO and ITO Services Revenue (USD Million) By Applications (2023-2030)
Table 53 Research Programs/Design for This Report
Table 54 Key Data Information from Secondary Sources
Table 55 Key Data Information from Primary Sources
List of Figures
Figure 1 Market Scope
Figure 2 Porter’s Five Forces
Figure 3 Global BPO and ITO Services Revenue (USD Million) By Type (2018-2022)
Figure 4 Global BPO and ITO Services Revenue Market Share (%) By Type (2022)
Figure 5 Global BPO and ITO Services Revenue (USD Million) By Applications (2018-2022)
Figure 6 Global BPO and ITO Services Revenue Market Share (%) By Applications (2022)
Figure 7 Global BPO and ITO Services Market Revenue (USD Million) By Regions (2018-2022)
Figure 8 Global BPO and ITO Services Market Share (%) By Regions (2022)
Figure 9 North America BPO and ITO Services Revenue (USD Million) By Country (2018-2022)
Figure 10 North America BPO and ITO Services Revenue (USD Million) By Type (2018-2022)
Figure 11 North America BPO and ITO Services Revenue (USD Million) By Applications (2018-2022)
Figure 12 Europe BPO and ITO Services Revenue (USD Million) By Country (2018-2022)
Figure 13 Europe BPO and ITO Services Revenue (USD Million) By Type (2018-2022)
Figure 14 Europe BPO and ITO Services Revenue (USD Million) By Applications (2018-2022)
Figure 15 Asia Pacific BPO and ITO Services Revenue (USD Million) By Country (2018-2022)
Figure 16 Asia Pacific BPO and ITO Services Revenue (USD Million) By Type (2018-2022)
Figure 17 Asia Pacific BPO and ITO Services Revenue (USD Million) By Applications (2018-2022)
Figure 18 South America BPO and ITO Services Revenue (USD Million) By Country (2018-2022)
Figure 19 South America BPO and ITO Services Revenue (USD Million) By Type (2018-2022)
Figure 20 South America BPO and ITO Services Revenue (USD Million) By Applications (2018-2022)
Figure 21 Middle East and Africa BPO and ITO Services Revenue (USD Million) By Region (2018-2022)
Figure 22 Middle East and Africa BPO and ITO Services Revenue (USD Million) By Type (2018-2022)
Figure 23 Middle East and Africa BPO and ITO Services Revenue (USD Million) By Applications (2018-2022)
Figure 24 Global BPO and ITO Services Revenue (USD Million) By Type (2023-2030)
Figure 25 Global BPO and ITO Services Revenue Market Share (%) By Type (2030)
Figure 26 Global BPO and ITO Services Revenue (USD Million) By Applications (2023-2030)
Figure 27 Global BPO and ITO Services Revenue Market Share (%) By Applications (2030)
Figure 28 Global BPO and ITO Services Market Revenue (USD Million) By Regions (2023-2030)
Figure 29 North America BPO and ITO Services Revenue (USD Million) By Country (2023-2030)
Figure 30 North America BPO and ITO Services Revenue (USD Million) By Type (2023-2030)
Figure 31 North America BPO and ITO Services Revenue (USD Million) By Applications (2023-2030)
Figure 32 Europe BPO and ITO Services Revenue (USD Million) By Country (2023-2030)
Figure 33 Europe BPO and ITO Services Revenue (USD Million) By Type (2023-2030)
Figure 34 Europe BPO and ITO Services Revenue (USD Million) By Applications (2023-2030)
Figure 35 Asia Pacific BPO and ITO Services Revenue (USD Million) By Country (2023-2030)
Figure 36 Asia Pacific BPO and ITO Services Revenue (USD Million) By Type (2023-2030)
Figure 37 Asia Pacific BPO and ITO Services Revenue (USD Million) By Applications (2023-2030)
Figure 38 South America BPO and ITO Services Revenue (USD Million) By Country (2023-2030)
Figure 39 South America BPO and ITO Services Revenue (USD Million) By Type (2023-2030)
Figure 40 South America BPO and ITO Services Revenue (USD Million) By Applications (2023-2030)
Figure 41 Middle East and Africa BPO and ITO Services Revenue (USD Million) By Region (2023-2030)
Figure 42 Middle East and Africa BPO and ITO Services Revenue (USD Million) By Region (2023-2030)
Figure 43 Middle East and Africa BPO and ITO Services Revenue (USD Million) By Type (2023-2030)
Figure 44 Middle East and Africa BPO and ITO Services Revenue (USD Million) By Applications (2023-2030)
Figure 45 Bottom-Up and Top-Down Approaches for This Report
Figure 46 Data Triangulation
By Type
By End-User
By Region
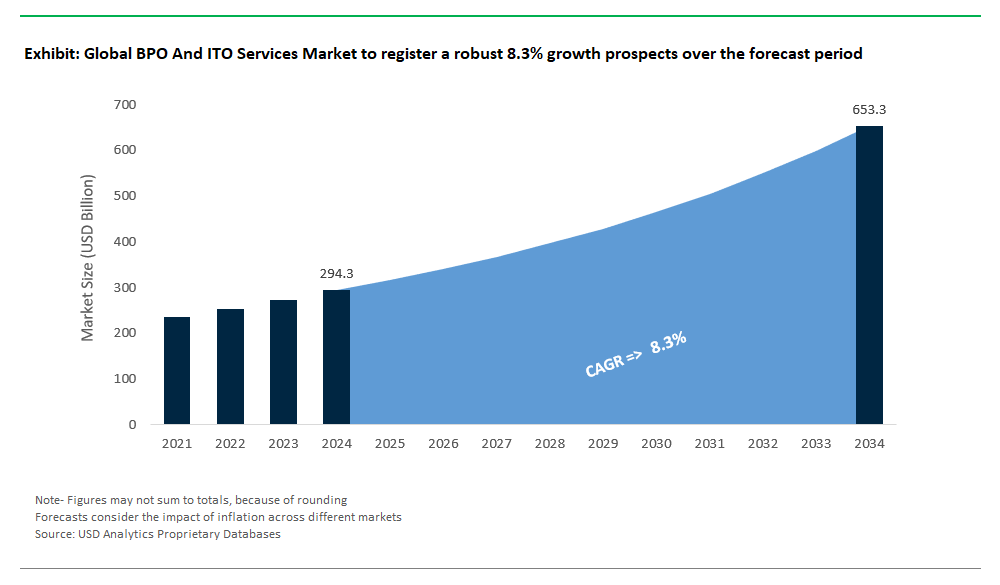
BPO And ITO Services Market Size is valued at $294.3 Billion in 2024 and is forecast to register a growth rate (CAGR) of 8.3% to reach $653.2 Billion by 2034.
Emerging Markets across Asia Pacific, Europe, and Americas present robust growth prospects.
Accenture, Capgemini, Cognizant, Concentrix, Genpact, HCL Technologies, Helpware, IBM, Infosys Technologies, Intetics, Octopus Tech, Plaxonic Technologies, Sciencesoft, Sodexo, SunTec India, TCS, Unity Communications, Wipro Technologies
Base Year- 2024; Estimated Year- 2025; Historic Period- 2019-2024; Forecast period- 2025 to 2034; Currency: Revenue (USD); Volume